Should you buy Autolus Therapeutics stock now?
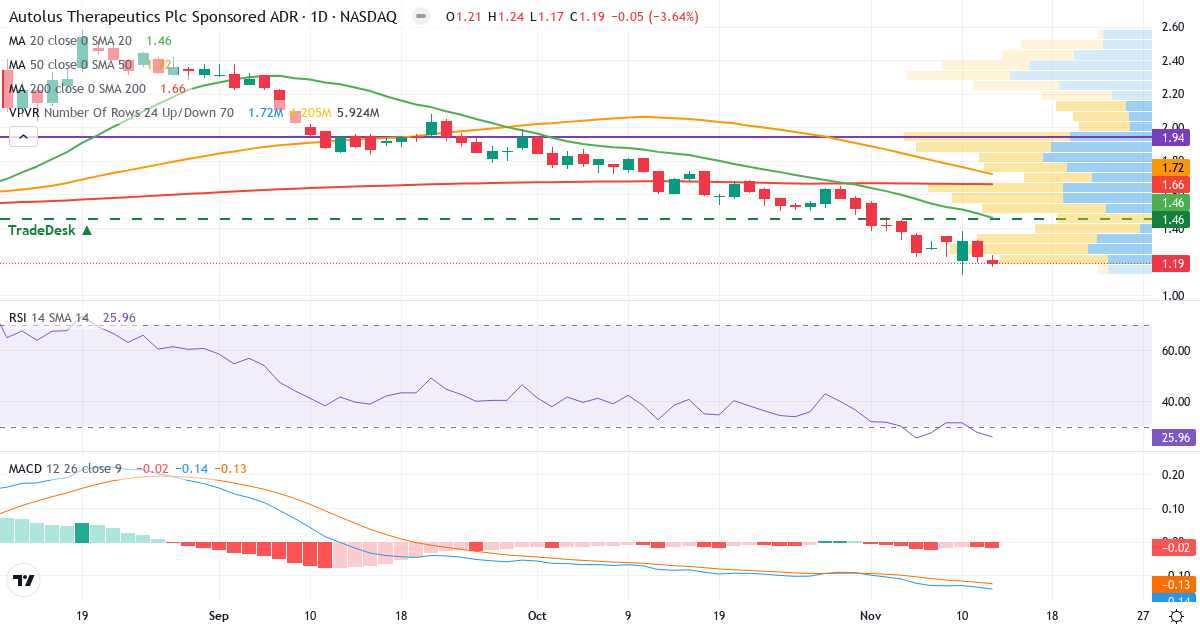
No, the technical signal for Autolus Therapeutics is currently Strong Sell. Autolus Therapeutics trades at $1.17 as of Nov 14, 2026. The technical analysis shows the following: MACD is negative (bearish trend) at -0.146 with falling momentum (signal: -0.130); RSI is at 25.2 (oversold), which could point to a potential buying opportunity; the stock is in a short-term downtrend (price below the 20-day average); the analyst price target of $8.36 points to 614.5% upside. The stock is in a broader downtrend (below SMA50/SMA200). Buying in a downtrend is generally not recommended. This is a technical observation based on current data, not investment advice.
What is the price target for Autolus Therapeutics stock?
The average analyst price target for Autolus Therapeutics is $8.36. The current price is $1.17, which gives an upside of 614.5%. Based on this, the stock is considered undervalued. The fair value range (±10% of the price target) is between $7.52 and $9.20.
Is Autolus Therapeutics a dividend stock?
No, Autolus Therapeutics does not currently pay a dividend to shareholders. The company reinvests its profits in growth instead of paying dividends.
What is the risk of Autolus Therapeutics stock?
Autolus Therapeutics is rated as a stock in the risk category Unknown. an RSI of 25.2 signals oversold (potential bottom).
Is Autolus Therapeutics overvalued?
No, Autolus Therapeutics is considered undervalued based on the analyst price target (614.5% upside). Autolus Therapeutics has the following valuation ratios: a P/S ratio of 2.3, a P/B ratio of 12.0. The analyst price target suggests that the stock is undervalued by 614.5%.
Is Autolus Therapeutics overbought?
No, Autolus Therapeutics is actually oversold with an RSI of 25.2 (below 30). The technical indicators show: RSI is at 25.2 (below the 30 mark), which actually signals the price is oversold – the opposite of overbought. In addition, the price is 18.8% below the 20-day average (short-term downtrend). In addition, MACD is negative with falling momentum (bearish). IMPORTANT: The stock is oversold in a downtrend. A low RSI in a downtrend is NOT a buy signal – the price can keep falling. Wait for a trend reversal before buying.
When is the next Autolus Therapeutics earnings report?
The date of the next earnings report for Autolus Therapeutics has not been published yet. Check the company's investor calendar for updates.
Is Autolus Therapeutics shorted?
Yes, Autolus Therapeutics is shorted with 5.0% of the free float sold short. This is a high level of short selling, which suggests some investors are betting on falling prices. Positive surprises can lead to a moderate short squeeze. The figure comes from our data provider EODHD, is reported about twice a month, and we check it every trading day.
Are insiders buying Autolus Therapeutics stock?
No, insiders are not buying Autolus Therapeutics shares – they are net sellers. Over the last 3 months, insiders have made 0 purchases and 1 sales. On a net basis, 15,708 USD worth of shares were sold. Across the last 1 reported transactions, the split is 0 purchases and 1 sales, with a net 15,708 USD sold. Active sellers include Piccina Cintia. Insider selling can have several explanations (e.g. planned 10b5-1 sales, portfolio diversification or taxes), but sustained selling by several insiders is worth watching closely.
Is Autolus Therapeutics a good stock?
Based on our total score, Autolus Therapeutics is rated as a disastrous stock with a total score of 12 out of 100. The stock scores very low on value, quality and momentum – it is among the worst in our database. The score is made up of Value: 15/100, Quality: 6/100, Momentum: 15/100. In addition: analysts see 614.5% upside to the price target. Whether now is the time to buy is a separate question: the technical signal is Strong Sell. Whether Autolus Therapeutics is a good investment depends on your time horizon, risk profile and portfolio. This is a data-driven observation, not investment advice.
What is the outlook for Autolus Therapeutics stock?
The outlook for Autolus Therapeutics based on current data: the average analyst price target is $8.36 (+614.5%); the stock is in a downtrend (below SMA50 and SMA200). Keep in mind that stock prices are affected by many factors, including earnings reports, the economy and market sentiment. Past returns are no guarantee of future returns.
Why is Autolus Therapeutics stock falling?
Autolus Therapeutics is falling right now. The technical indicators show: the price is 18.8% below the 20-day average; MACD is negative with falling momentum (bearish signal); short interest is 5.0% (high – many are betting on a decline); insiders have mostly been selling the stock recently. For the latest context, see our technical analysis and insider section above.
How high can Autolus Therapeutics go?
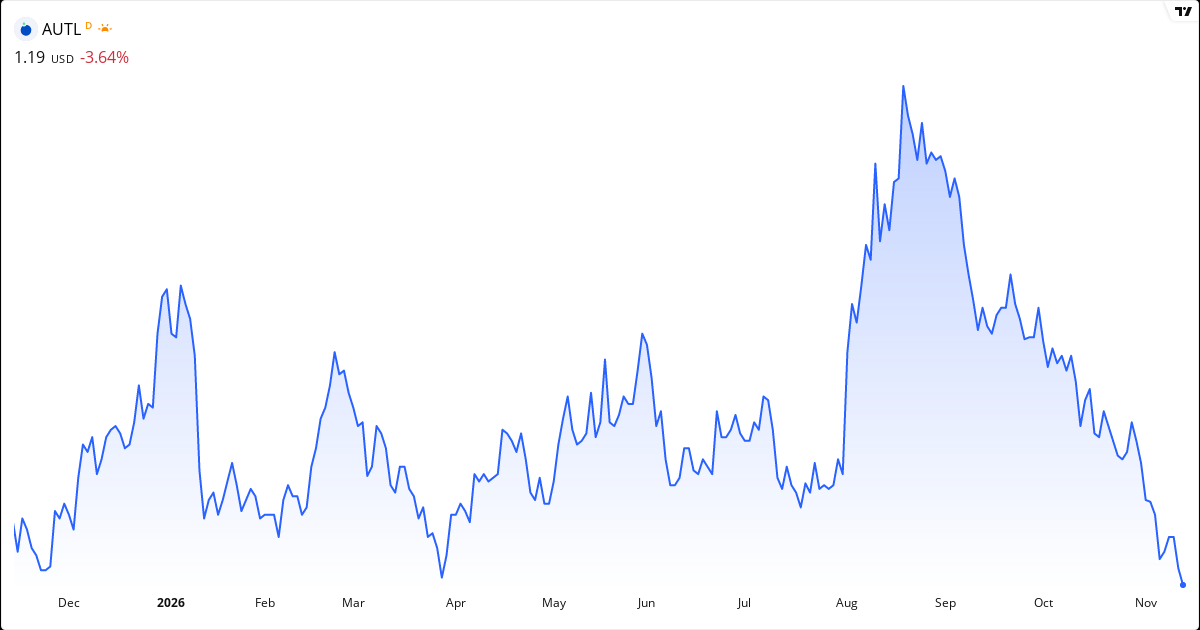
The average analyst price target for Autolus Therapeutics is $8.36, which corresponds to a potential gain of 614.5% from the current price of $1.17. The stock has traded between $1.12 and $2.58 over the last 52 weeks. The price is 54.7% below the 52-week high, which can indicate potential if the underlying fundamentals are intact. Keep in mind that price targets are estimates, not guarantees. Actual price moves depend on earnings, market conditions and unexpected events.
How low can Autolus Therapeutics fall?
The stock has traded as low as $1.12 over the last 52 weeks — that is 4.3% below the current price of $1.17. The biggest decline (drawdown) in the same period was 56.6% from high to low. Remember: past price swings are no guarantee for the future — a stock can fall further than the last 52 weeks suggest, especially on profit warnings, sector crises or a market crash. Use stop-loss orders and spread your portfolio to limit losses in single stocks.
What does Autolus Therapeutics do?
Autolus Therapeutics plc, a clinical-stage biopharmaceutical company, develops T cell therapies for the treatment of cancer and autoimmune diseases in the United Kingdom and internationally. The company offers AUCATZYL, a gene therapy product consisting of autologous T cells t... The company belongs to the Healthcare sector, more specifically the Biotechnology industry, is headquartered in United States, and is traded on the USA Stocks. See the key figures, earnings history and price development above to evaluate Autolus Therapeutics as an investment.
Did Autolus Therapeutics raise or lower its guidance?
Over the last 60 days we have not registered a guidance raise or cut from Autolus Therapeutics. The company can still adjust its guidance at quarterly reports or between reports — see the earnings history above.
Is Autolus Therapeutics making money or losing money?
No, Autolus Therapeutics is currently not making money — the company is losing money with a negative profit margin of -186.4%, a substantial loss. That means the business loses money on every dollar of revenue. The operating margin (profit before interest and taxes) is also negative at -159.4% — so it is not just financing costs weighing on the result. For growth stocks investing in expansion this is normal — but it raises the risk if the company does not reach break-even before its capital runs out.
Can Autolus Therapeutics go bankrupt?
The bankruptcy risk of Autolus Therapeutics is rated as elevated. Altman Z2 (a model for assessing financial distress) is -8.89 — that places the company in the weak zone. This is a probability based on the numbers, not a verdict — bankruptcy is not imminent. But the balance sheet is measurably weaker than average, so watch the debt, liquidity and possible capital raises. The Piotroski score (financial health 0-9, higher is better) is 4 — which is average. Debt relative to equity is 83% (moderate). Remember: models like Altman Z2 are statistical — unexpected shocks (fraud, a sector collapse, lawsuits) can always happen. Spread your portfolio.
Does Autolus Therapeutics have a lot of debt?
Autolus Therapeutics has moderate debt relative to equity. The debt-to-equity ratio (D/E — interest-bearing debt to equity) is 83%. For the healthcare sector, 80-150% counts as a typical level. In healthcare, 80-150% is typical — large pharma companies carry debt for research and acquisitions. Note: D/E levels are highly sector-specific — a bank at 300% debt is normal, a tech stock at 300% is extremely leveraged. Always compare with similar companies in the same sector.