Evaxion Biotech (EVAX.US) Price Target 2026/2027: 275% Upside – Rating and Stock Analysis
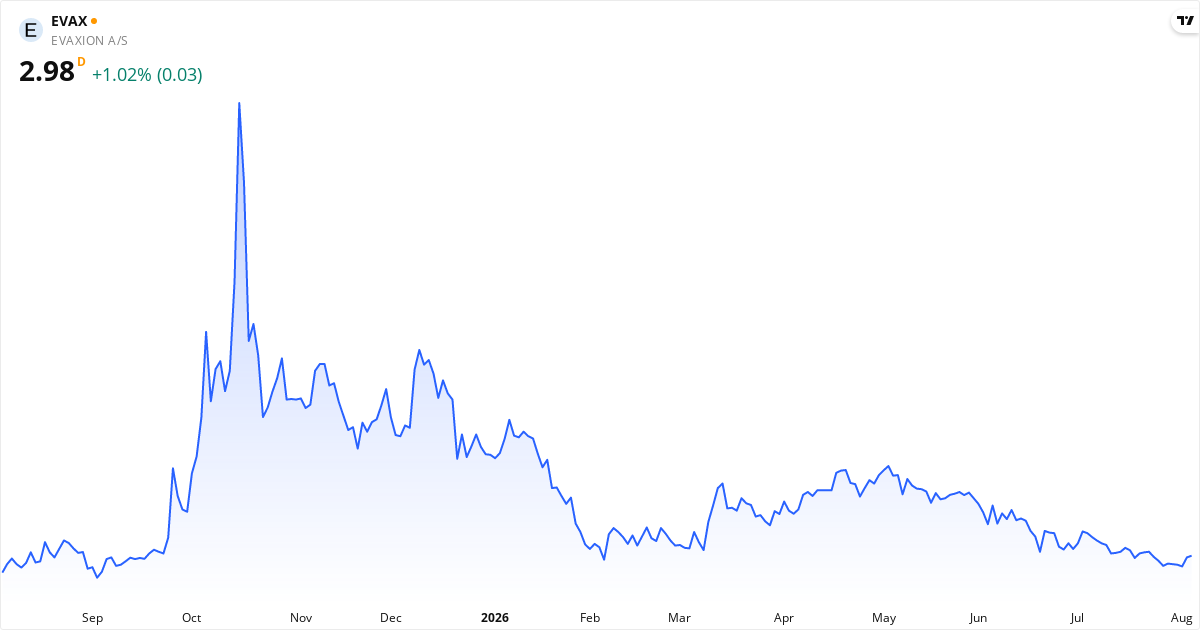
Evaxion Biotech Price Target 2026: Analysts See 276% Upside
The average price target for Evaxion Biotech is $11.25. This price target represents the analysts' view of the stock price over the next 12 months. The stock may be undervalued, because the price target is higher than the current price. The stock is 275,63% below the target, which can point to potential returns within the next 12 months if the analysts' view proves right. Also consider the stock's valuation ratios such as P/E, P/S and P/B, plus the technical analysis further down the page, for the full picture.Is Evaxion Biotech overvalued or undervalued?
Evaxion Biotech is currently undervalued with a gap of 275.6% relative to the price target.
The current price is $3.00, which places Evaxion Biotech in the undervalued category. The stock is considered undervalued when the price is below $10.13, and overvalued when the price exceeds $12.38.
The fair value range is defined as ±10% of the price target, because price targets are estimates rather than exact values. For Evaxion Biotech, the fair value range lies between $10.13 and $12.38.
Analyst Ratings for Evaxion Biotech stock in 2026: Strong Buy
2 analysts cover Evaxion Biotech. There is broad agreement on a positive view — 100% recommend buying. The average price target is $11.25, which gives an upside of 275.6% from the current price.
About Evaxion Biotech – Bioteknologi
Evaxion Biotech A/S bruger kunstig intelligens til at udvikle nye behandlinger. De laver immunterapi mod både kræft, bakterier og virusser. Evaxion har tre forskellige AI-platforme, som de bruger til at finde de bedste kandidater: PIONEER, EDEN og RAVEN. Lige nu har Evaxion flere lægemidler i kliniske forsøg. EVX-01 og EVX-02 er to kræftmidler i fase 1/2a, og EVX-03 er længere fremme i fase 2b til forskellige kræftformer. De har også EVX-B1 og EVX-V1, som er i præklinisk fase mod infektionssygdomme. Virksomheden samarbejder også med andre for at få deres teknologier ud. Read more about the companyKey Figures for Evaxion Biotech
What kind of stock is Evaxion Biotech?
Evaxion Biotech is classified as a speculative stock.
Score Overview for Evaxion Biotech
📈 Valuation
The P/S ratio is 3.3. The P/B ratio is 2.1.
🏦 Financial Health
The Piotroski score is 2 out of 9 — weak financial health, be careful. Altman Z2 is -15.70 (weak balance sheet — elevated risk). The debt-to-equity ratio (D/E) is 1,000.0% — high debt, which raises the risk.
🚀 Momentum & Short Interest
Short interest is 0.30% — low, the market does not expect a decline.
When Does Evaxion Biotech Report Earnings – Next Date: 8/20/2026
The next earnings report from Evaxion Biotech is scheduled for August 20, 2026, before the market opens. This report covers the second quarter (Q2), which ended on June 30, 2026.Technical Analysis of Evaxion Biotech 2026 – Signal: Strong Sell
Based on trend analysis (SMA50/SMA200) and MACD trend (positive/negative on a daily + weekly basis). Updated August 6, 2026.
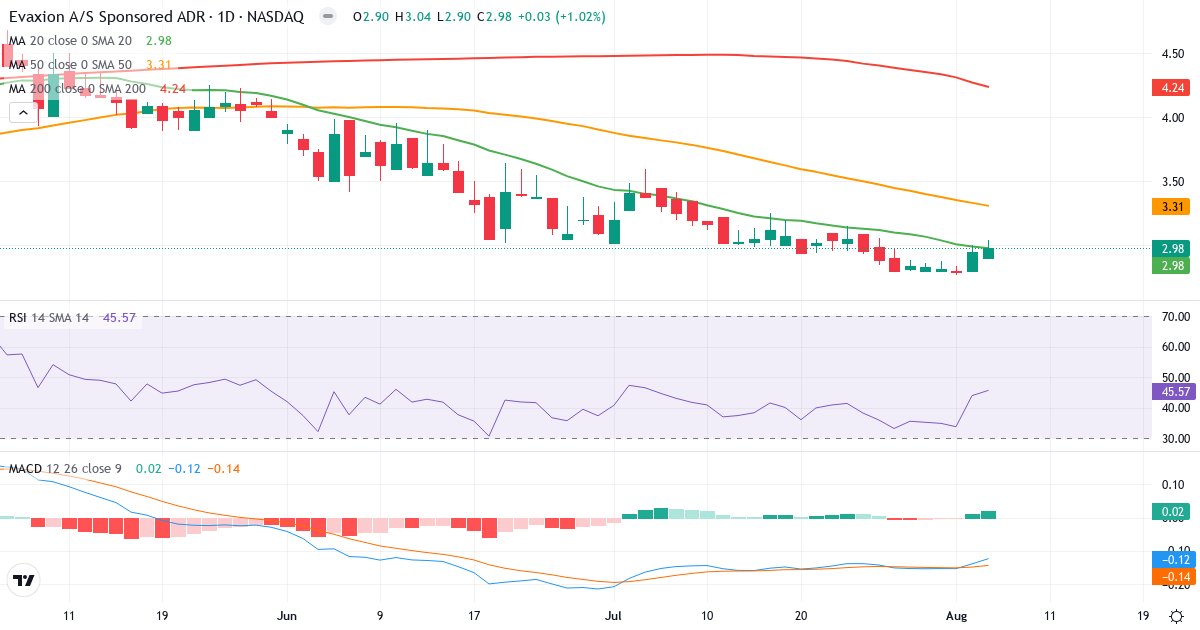
Trend Analysis of Evaxion Biotech A/S
Evaxion Biotech A/S is in a short-term uptrend. The price of $2.98 is 0.0% above the 20-day average ($2.98). Medium term, the picture is negative: the price is 10.0% below the 50-day average ($3.31). Long term, the stock is 29.7% below the 200-day average ($4.24), which signals a long-term downtrend.
Death Cross: The 50-day average (3.31) is below the 200-day average (4.24), which is a classic bearish signal for Evaxion Biotech A/S.
Is Evaxion Biotech A/S overbought or oversold?
Evaxion Biotech A/S has an RSI of 45.6, right in the middle of the neutral zone. There is no clear buying or selling pressure.
MACD Analysis for Evaxion Biotech A/S
Daily MACD: MACD is negative (-0.124), which means the short-term trend is bearish (the 12-day EMA is below the 26-day EMA). MACD is above the signal line (-0.144) by 0.020, which suggests the negative momentum is fading – a potential trend reversal could be ahead.
Weekly MACD: MACD5 is negative (-0.330), which indicates a broader bearish long-term trend. MACD5 is below the signal line (-0.233) by 0.097, which confirms continued negative long-term momentum.
Overall MACD assessment: Both the daily and weekly trend are bearish (MACD negative). However, momentum shows signs of improving on a daily basis – a potential trend reversal could be ahead, but it is not confirmed yet.
Risk Profile for Evaxion Biotech A/S
Evaxion Biotech A/S has an annual standard deviation of 113.3%, which classifies the stock as extreme risk. Only risk-tolerant investors should consider this stock, because the price swings can be very large.
Overall Technical Conclusion for Evaxion Biotech A/S
Trend: Negative. The price trades below SMA50 and SMA200.
MACD trend (zero line): Daily bearish (-0.124). Weekly bearish (-0.330).
MACD momentum (signal): Daily rising. Weekly falling.
RSI: 45.6 – neutral.
Technical signal: Strong Sell
The price is in a downtrend (below SMA50/SMA200) and MACD is negative on both a daily and weekly basis. Avoid buying and consider closing existing positions.