Fastenal (FAST.US) Price Target and Rating 2026/2027
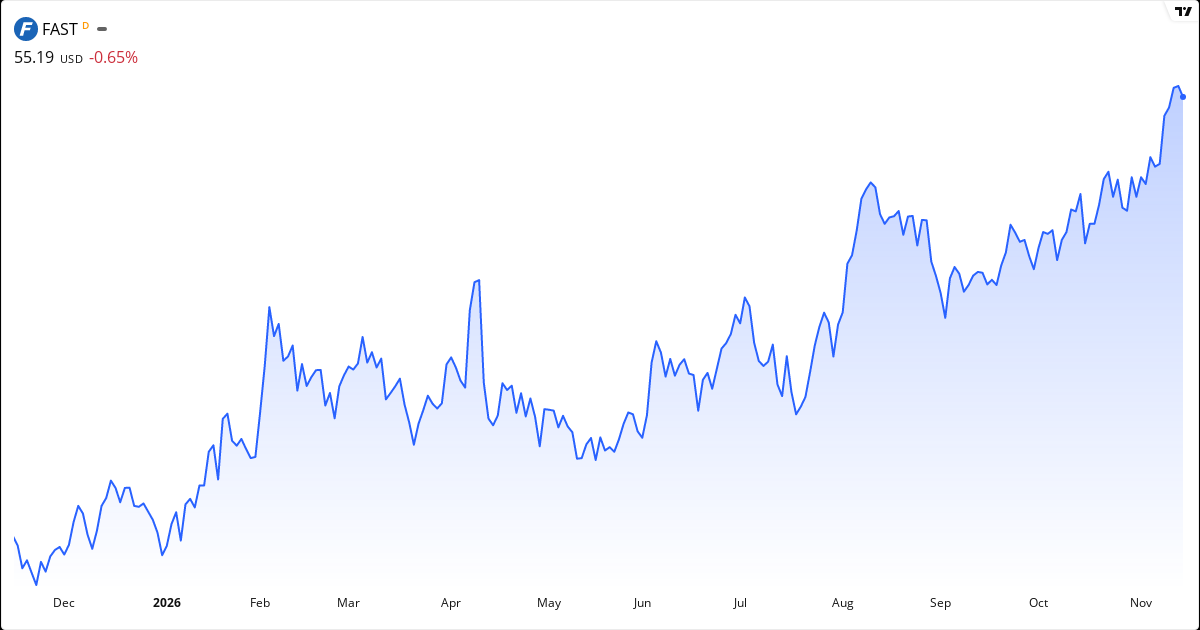
Fastenal 2026 Price Target
The average price target for Fastenal is $51.15. This price target represents the analysts' view of the stock price over the next 12 months. The stock may be undervalued, because the price target is higher than the current price. The stock is 0% below the target, which can point to potential returns within the next 12 months if the analysts' view proves right. Also consider the stock's valuation ratios such as P/E, P/S and P/B, plus the technical analysis further down the page, for the full picture.Is Fastenal overvalued or undervalued?
Fastenal is currently fairly valued with a gap of 0% relative to the price target.
The current price is $0.00, which places Fastenal in the fairly valued category. The stock is considered undervalued when the price is below $46.04, and overvalued when the price exceeds $56.27.
The fair value range is defined as ±10% of the price target, because price targets are estimates rather than exact values. For Fastenal, the fair value range lies between $46.04 and $56.27.
Analyst Ratings for Fastenal stock in 2026: Hold
18 analysts cover Fastenal. The ratings are mixed, with 33.3% Buy, 38.9% Hold and 27.8% Sell.
About Fastenal – Industrial Distribution
Fastenal Company, together with its subsidiaries, engages in the wholesale distribution of industrial and construction supplies in the United States, Canada, Mexico, and internationally. It offers fasteners, and related industrial and construction supplies under the Fastenal name. The company's fastener products include threaded fasteners, bolts, nuts, screws, studs, and related washers that are used in manufactured products and construction projects, as well as in the maintenance and repair of machines. It offers miscellaneous supplies and hardware, including pins, machinery keys, concrete anchors, metal framing systems, wire ropes, strut products, rivets, and related accessories. The company serves the manufacturing market comprising original equipment manufacturers; maintenance, repair, and operations customers; non-residential construction market; farmers, truckers, railroads, mining companies, schools, and retail trades; and oil exploration, production, and refinement companies, as well as federal, state, and local governmental entities. Fastenal Company was founded in 1967 and is headquartered in Winona, Minnesota. Read more about the companyKey Figures for Fastenal
What kind of stock is Fastenal?
Fastenal is classified as a growth stock and quality stock. This means the stock combines several attractive traits, strong financial health (Piotroski 7/9).
Score Overview for Fastenal
📈 Valuation
Fastenal trades at a P/E ratio of 44.9, which is above the market average. The forward P/E is 39.7 (12% lower), which suggests the market expects rising earnings. The P/S ratio is 7.0 (high — the market pays a premium for the revenue). The P/B ratio is 15.4. The PEG ratio is 3.59 — above 2.0 suggests the stock is expensive relative to its growth rate.
💵 Profitability & Growth
Fastenal has a profit margin of 15.6% (solid) and an operating margin of 20.5%. Return on equity (ROE) is 35.3% — excellent return on equity. Return on assets (ROA) is 22.0%. The latest quarterly earnings grew 20.7% year over year.
🏦 Financial Health
The Piotroski score is 7 out of 9 — good financial health. Altman Z2 is 11.39 (healthy balance sheet — low risk). The debt-to-equity ratio (D/E) is 29.9% — low debt, a solid balance sheet.
🚀 Momentum & Short Interest
Short interest is 3.81%.
Fastenal Dividend
How much does Fastenal pay in dividends?
Fastenal does not currently pay a dividend. This may be because the company reinvests its profits in growth, or because there is not enough profit for dividend payments. You can find more information about the dividend policy on the company's website.
Historical Dividend Payments for Fastenal
No historical dividend payments are registered for this stock.
| Ex-date | Payment date | Amount | Currency |
|---|---|---|---|
| No historical dividend payments available. | |||
Fastenal Short Selling 2026: 3.8% Sold Short
Short interest comes from our data provider EODHD. The figure is reported about twice a month; we check it every trading day.
When Does Fastenal Report Earnings?
The next earnings date for Fastenal is not yet available. Check the company's investor calendar for more information.Technical Analysis of Fastenal 2026 – Signal: Buy
Based on trend analysis (SMA50/SMA200) and MACD trend (positive/negative on a daily + weekly basis). Updated November 14, 2026.
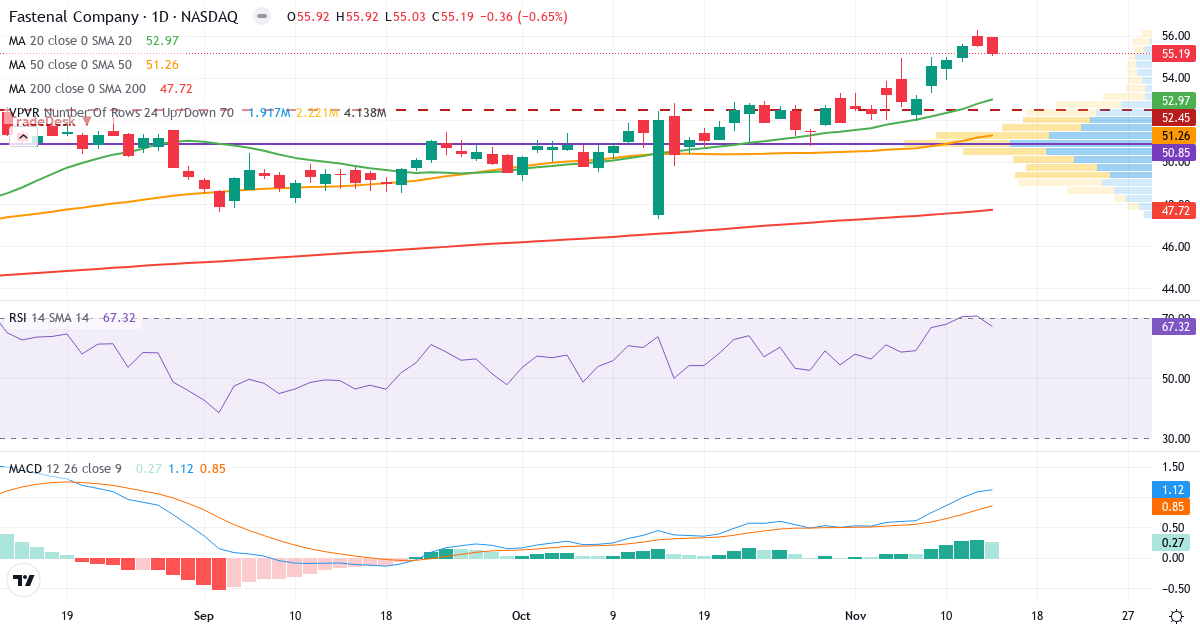
Trend Analysis of Fastenal Company
Fastenal Company is in a short-term uptrend. The price of $55.19 is 4.4% above the 20-day average ($52.88). Medium term, the picture is positive: the price is 8.1% above the 50-day average ($51.08). Long term, the stock is 16.7% above the 200-day average ($47.28), which confirms a long-term uptrend.
Golden Cross: The 50-day average (51.08) is above the 200-day average (47.28), which is a classic bullish signal for Fastenal Company.
Is Fastenal Company overbought or oversold?
Fastenal Company has an RSI of 68.0. The stock shows positive momentum in the upper part of the neutral zone.
MACD Analysis for Fastenal Company
Daily MACD: MACD is positive (1.183), which means the short-term trend is bullish (the 12-day EMA is above the 26-day EMA). MACD is above the signal line (0.915) by 0.268, which confirms rising momentum in the uptrend.
Weekly MACD: MACD5 is positive (2.013), which indicates a broader bullish long-term trend. MACD5 is above the signal line (1.628) by 0.385, which confirms rising long-term momentum.
Overall MACD assessment: Both the daily and weekly MACD are positive and above their signal lines. Trend and momentum confirm each other across time horizons – the strongest bullish signal.
Overall Technical Conclusion for Fastenal Company
Trend: Neutral/mixed.
MACD trend (zero line): Daily bullish (1.183). Weekly bullish (2.013).
MACD momentum (signal): Daily rising. Weekly rising.
RSI: 68.0 – neutral.
Technical signal: Buy
The broader trend is positive and MACD supports the picture. Consider buying with a stop-loss below the nearest support level.
Who Owns Fastenal?
The three largest owners of Fastenal are BlackRock Inc (9.3%), Vanguard Capital Management, LLC (6.5%) and Vanguard Portfolio Management, LLC (5.7%). The percentage is their share of the stock, as of Jun 30, 2026. Source: our data provider EODHD.
The 10 Largest Institutions
| Institution | Stake | Change |
|---|---|---|
| BlackRock Inc | 9.27% | +1.5% |
| Vanguard Capital Management, LLC | 6.53% | +0.5% |
| Vanguard Portfolio Management, LLC | 5.66% | +0.7% |
| State Street Corp | 4.92% | +1.6% |
| Charles Schwab Investment Management Inc | 3.74% | +8.9% |
| Amvescap Plc. | 3.45% | +3.5% |
| Geode Capital Management, LLC | 3.44% | +1.4% |
| Morgan Stanley - Brokerage Accounts | 1.82% | −19.0% |
| Bank of New York Mellon Corp | 1.56% | −27.4% |
| Bank of America Corp | 1.41% | −1.1% |
As of Jun 30, 2026. "Change" is the change in shares held since the holder's previous report.
The 5 Largest Funds
| Fund | Stake | Change |
|---|---|---|
| Vanguard MStar Total Stk Mkt Idx Invest | 3.17% | −0.2% |
| Schwab US Dividend Equity ETF™ | 2.85% | +0.1% |
| Vanguard 500 Index Investor | 2.63% | −1.2% |
| Vanguard MStar Mid Cap Index Instl | 2.14% | −1.1% |
| Invesco QQQ Trust | 2.08% | −0.1% |
As of Oct 31, 2026. A fund may be managed by one of the institutions above, so the two lists cannot be added together.
Frequently Asked Questions About Fastenal stock in 2026
Should you buy Fastenal stock now?
What is the price target for Fastenal stock?
Is Fastenal a dividend stock?
What is the risk of Fastenal stock?
Is Fastenal overvalued?
Is Fastenal overbought?
When is the next Fastenal earnings report?
Is Fastenal shorted?
Are insiders buying Fastenal stock?
Is Fastenal a good stock?
What is the outlook for Fastenal stock?
Why is Fastenal stock moving?
How high can Fastenal go?
How low can Fastenal fall?
What does Fastenal do?
Did Fastenal raise or lower its guidance?
Is Fastenal making money or losing money?
Can Fastenal go bankrupt?
Does Fastenal have a lot of debt?
Other Stocks in Industrials
Compare Fastenal with other stocks in the industrials sector. Click a stock to see its technical analysis, insider trading and key figures.
See all 139 stocks in the Industrials sector