Ideal Power (IPWR.US) Price Target 2026/2027: 150% Upside – Rating and Stock Analysis

4,28
2,15%
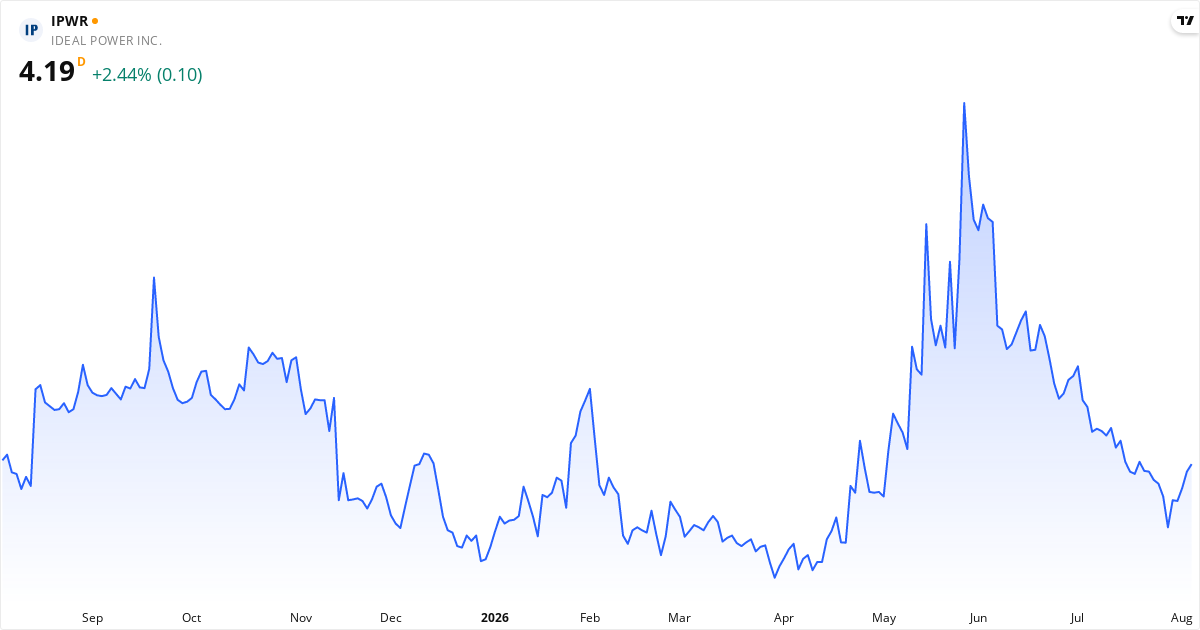
Price history for Ideal Power (IPWR.US) – stock price at 4.28 $, August 2026
Ideal Power stock price – price development 2026. Updated Aug 6, 2026.
Share this analysis:

Ideal Power Price Target 2026: Analysts See 151% Upside

The average price target for Ideal Power is $10.75. This price target represents the analysts' view of the stock price over the next 12 months. The stock may be undervalued, because the price target is higher than the current price. The stock is 151,17% below the target, which can point to potential returns within the next 12 months if the analysts' view proves right. Also consider the stock's valuation ratios such as P/E, P/S and P/B, plus the technical analysis further down the page, for the full picture.

Is Ideal Power overvalued or undervalued?

Ideal Power is currently undervalued with a gap of 151.2% relative to the price target.


The current price is $4.28, which places Ideal Power in the undervalued category. The stock is considered undervalued when the price is below $9.68, and overvalued when the price exceeds $11.83.


The fair value range is defined as ±10% of the price target, because price targets are estimates rather than exact values. For Ideal Power, the fair value range lies between $9.68 and $11.83.


See the full price target analysis for Ideal Power →

Analyst Ratings for Ideal Power stock in 2026: Hold

1 analysts cover Ideal Power. Analysts are mostly neutral — 100% recommend Hold. The average price target is $10.75, which gives an upside of 151.2% from the current price.

Consensus: Hold (3.00/5)
Hold
1 (100%)
Strong Sell Sell Hold Buy Strong Buy
3.00 out of 5 based on 1 analysts

About Ideal Power – Semiconductors

Ideal Power Inc. tjener penge på at udvikle og sælge deres unikke B-TRAN teknologi. Kort sagt laver de en særlig type solid state switch, som de kalder Bi-directional bi-polar junction TRANsistorer. Det er en kernekomponent, der bruges i mange former for strømstyring. Ideal Power Inc. blev grundlagt tilbage i 2007 og startede oprindeligt som Ideal Power Converters Inc., men skiftede navn i 2013. De driver deres forretning fra hovedkvarteret i Austin, Texas. De fokuserer udelukkende på at få B-TRAN teknologien ud på markedet, hvor den kan erstatte ældre, mindre effektive løsninger. De har altså en meget snæver, teknologisk niche. Read more about the company

Key Figures for Ideal Power

$ 67,2M Market cap
$ 25,7K Revenue
Semiconductors Industry
- P/E
2,610.85 P/S
3.43 P/B
USA Listed on exchange
Industri Sector

What kind of stock is Ideal Power?

Speculative stock

Ideal Power is classified as a speculative stock.

Score Overview for Ideal Power

💰 Value Score 11/100 (Very Low)
⭐ Quality Score 8/100 (Very Low)
🚀 Momentum Score 12/100 (Very Low)
📊 Total Score 10/100

⚠️ 3 red flags identified 2 critical

Our analysis has identified 3 potential risk factors in Ideal Power that investors should be aware of.

⚠️ Weak financial health: The Piotroski score is only 2/9 – the company shows signs of weakened profitability, liquidity or capital structure.
🚨 Weak balance sheet (elevated risk): Altman Z2 is -11.21 – the balance sheet is measurably weaker than average. This is a risk signal based on the numbers, not a bankruptcy prediction.
🚨 Negative return on equity: ROE is -69.0% – the company is generating a negative return for shareholders.

📈 Valuation

The P/S ratio is 2,610.8 (high — the market pays a premium for the revenue). The P/B ratio is 3.4. The PEG ratio is 0.26 — below 1.0 suggests the stock is cheap relative to its growth rate.

🏦 Financial Health

The Piotroski score is 2 out of 9 — weak financial health, be careful. Altman Z2 is -11.21 (weak balance sheet — elevated risk). The debt-to-equity ratio (D/E) is 11.0% — low debt, a solid balance sheet.

🚀 Momentum & Short Interest

Short interest is 4.81%.

Insider Trading in Ideal Power 2026: The Signal Is mostly negative

In 2026, insiders at Ideal Power have made 20 transactions – split into 7 purchases and 13 sales. On a net basis, insiders took 139,857 $ out of the stock. Active insiders include TURMELLE MICHAEL C, SOMO DAVID M, David M Somo and others. In the short term (last 3 months), the insider signal is mostly negative.

Short-Term Signal (3 months): Mostly negative

Insiders have sold more than they have bought over the last 3 months.

Over the last 3 months: 1 purchases and 6 sales. A net 505,185 $ out of the stock.

Long-Term Signal (all transactions): Mixed

There are both insider purchases and sales, with no clear direction. This is normal for large companies, where management adjusts positions on an ongoing basis.

Across the last 20 transactions: 7 purchases and 13 sales. A net 139,857 $ out of the stock.

Latest purchase: TURMELLE MICHAEL C bought 5,250 shares at 8 $ each on 2026-05-26. The stock has since fallen 44.9%.

Latest sale: BURNS TIMOTHY sold 5,247 shares at 6 $ each on 2026-06-20.

Who is buying: TURMELLE MICHAEL C, SOMO DAVID M, David M Somo, Lesster Laban E, Laban E Lesster and others.

Who is selling: BURNS TIMOTHY, SOMO DAVID M, BRDAR DANIEL.

Latest Insider Trades in Ideal Power (2026)

The table shows the last 20 reported insider transactions in Ideal Power. Green rows are purchases, red rows are sales. The data is based on official filings.

Transaction date Name Type Number of shares Price per share ($) Total amount ($)
2026-06-20 BURNS TIMOTHY Sell 5,247 6 31,692
2026-06-12 BURNS TIMOTHY Sell 2,928 6 17,861
2026-06-05 BURNS TIMOTHY Sell 6,667 6 40,202
2026-06-03 BURNS TIMOTHY Sell 6,667 7 49,736
2026-06-01 BURNS TIMOTHY Sell 6,666 7 48,662
2026-05-26 TURMELLE MICHAEL C Buy 5,250 8 39,900
2026-05-18 SOMO DAVID M Sell 61,860 6 356,932
2026-02-25 SOMO DAVID M Buy 90,909 3 250,000
2026-02-25 David M Somo Buy 90,909 3 250,000
2025-12-15 BURNS TIMOTHY Sell 3,607 4 13,887

Who is buying and selling Ideal Power shares in 2026?

The following insiders have bought shares in Ideal Power: TURMELLE MICHAEL C, SOMO DAVID M, David M Somo, Lesster Laban E, Laban E Lesster and others. In total, 628,370 $ was bought across 7 transactions. The following insiders have sold shares: BURNS TIMOTHY, SOMO DAVID M, BRDAR DANIEL. In total, 768,226 $ was sold across 13 transactions. Insider trades are legal transactions in which executives and board members buy or sell shares of their own company. These transactions are reported to the SEC and are publicly available.

Ideal Power Short Selling 2026: 4.8% Sold Short

Moderate short interest: 4.8% of the free float
Short % of free float
4.8%
Assessment
Moderate short interest
Short squeeze risk
Low
Data source
SEC
Updated daily
The stock has a moderate share of short selling. Between 2-5% of the freely traded shares are sold short, which is within the normal range for most stocks.

Data is updated daily based on official filings with the SEC.
Short Interest Scale
0% 2% 5% 10% 20%+
Low Moderate High Very High Extreme
4.8%

When Does Ideal Power Report Earnings – Next Date: 8/13/2026

The next earnings report from Ideal Power is scheduled for August 13, 2026, before the market opens. This report covers the second quarter (Q2), which ended on June 30, 2026.


Technical Analysis of Ideal Power 2026 – Signal: Sell

Overall Technical Signal: Sell

Based on trend analysis (SMA50/SMA200) and MACD trend (positive/negative on a daily + weekly basis). Updated August 6, 2026.

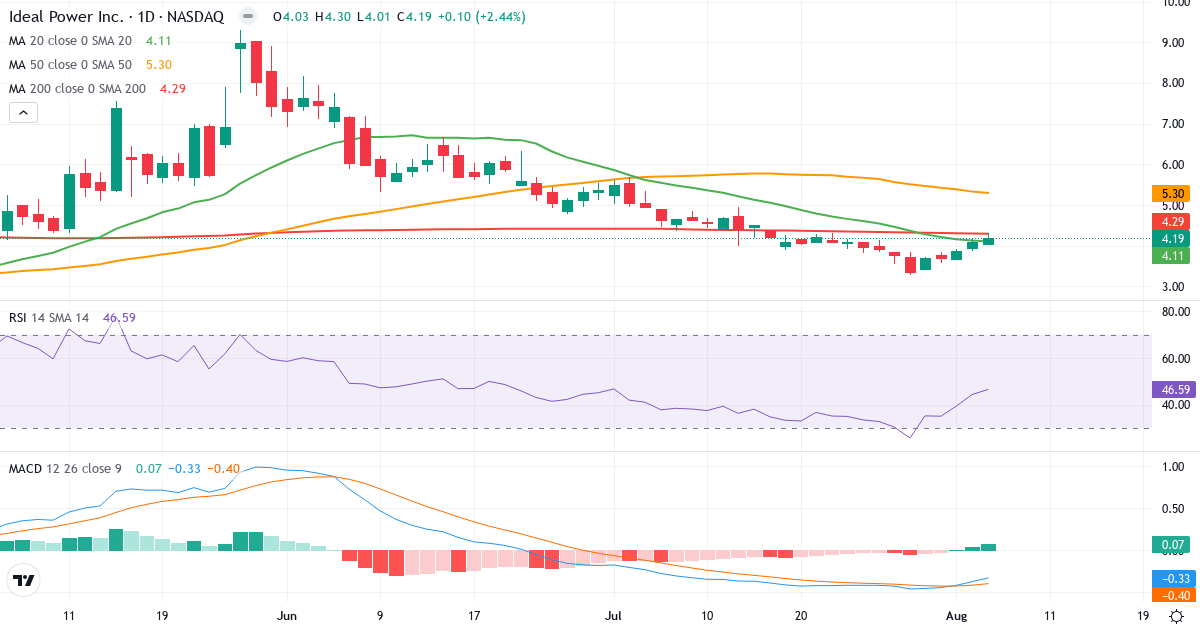
Technical analysis of Ideal Power (IPWR.US) – RSI 47, MACD negative (bearish), daily candlestick chart August 2026
Ideal Power technical analysis – candlestick chart with RSI and MACD. Updated Aug 6, 2026.

Trend Analysis of Ideal Power Inc

Ideal Power Inc is in a short-term uptrend. The price of $4.19 is 2.0% above the 20-day average ($4.11). Medium term, the picture is negative: the price is 20.9% below the 50-day average ($5.30). Long term, the stock is 2.4% below the 200-day average ($4.29), which signals a long-term downtrend.

Golden Cross: The 50-day average (5.30) is above the 200-day average (4.29), which is a classic bullish signal for Ideal Power Inc.

Is Ideal Power Inc overbought or oversold?

Ideal Power Inc has an RSI of 46.6, right in the middle of the neutral zone. There is no clear buying or selling pressure.

MACD Analysis for Ideal Power Inc

Daily MACD: MACD is negative (-0.331), which means the short-term trend is bearish (the 12-day EMA is below the 26-day EMA). MACD is above the signal line (-0.400) by 0.069, which suggests the negative momentum is fading – a potential trend reversal could be ahead.

Weekly MACD: MACD5 is positive (0.061), which indicates a broader bullish long-term trend. MACD5 is below the signal line (0.261) by 0.200, which suggests the long-term momentum is fading – the positive trend could come under pressure.

Overall MACD assessment: The daily and weekly MACD give conflicting signals. The long-term trend is bullish, but the short-term trend is bearish. Daily momentum is rising, though, which could suggest the pullback is over.

Risk Profile for Ideal Power Inc

Ideal Power Inc has an annual standard deviation of 123.3%, which classifies the stock as extreme risk. Only risk-tolerant investors should consider this stock, because the price swings can be very large.

Overall Technical Conclusion for Ideal Power Inc

Trend: Negative. The price trades below SMA50 and SMA200.

MACD trend (zero line): Daily bearish (-0.331). Weekly bullish (0.061).

MACD momentum (signal): Daily rising. Weekly falling.

RSI: 46.6 – neutral.

Technical signal: Sell

The trend is negative and MACD is below the zero line, which confirms the bearish momentum. Consider reducing the position or setting a stop-loss.

Frequently Asked Questions About Ideal Power stock in 2026

Should you buy Ideal Power stock now?
No, the technical signal for Ideal Power is currently SELL. Ideal Power trades at $4.28 as of 8/6/2026. The overall technical signal is: Sell. The technical analysis shows the following: MACD is negative (bearish trend) at -0.331 with rising momentum (signal: -0.400); RSI is at 46.6 (neutral zone); the stock is in a short-term uptrend (price above the 20-day average); the analyst price target of $10.75 points to 151.2% upside. The stock is in a broader downtrend (below SMA50/SMA200). Buying in a downtrend is generally not recommended. This is a technical observation based on current data, not investment advice.
What is the price target for Ideal Power stock?
The average analyst price target for Ideal Power is $10.75. The current price is $4.28, which gives an upside of 151.2%. Based on this, the stock is considered undervalued. The fair value range (±10% of the price target) is between $9.68 and $11.83.
Is Ideal Power a dividend stock?
No, Ideal Power does not currently pay a dividend to shareholders. The company reinvests its profits in growth instead of paying dividends.
What is the risk of Ideal Power stock?
Ideal Power is rated as a stock with extreme risk. the annual standard deviation is 123.3%, which classifies the stock as extreme risk.
Is Ideal Power overvalued?
No, Ideal Power is considered undervalued based on the analyst price target (151.2% upside). Ideal Power has the following valuation ratios: a P/S ratio of 2,610.8, a P/B ratio of 3.4. The analyst price target suggests that the stock is undervalued by 151.2%.
Is Ideal Power overbought?
No, Ideal Power is not overbought. RSI is at 46.6 (neutral zone). The technical indicators show: RSI is at 46.6 (neutral zone between 30-70), which signals neither overbought nor oversold. In addition, the price is 4.2% above the 20-day average (short-term uptrend). In addition, MACD is negative, but momentum is rising (possible trend reversal).
When is the next Ideal Power earnings report?
Ideal Power reports its next earnings on August 13, 2026. The stock currently trades at $4.28.
Is Ideal Power shorted?
Yes, Ideal Power is shorted with 4.8% of the free float sold short. This is a moderate level of short selling, within the normal range for most stocks. Data is updated daily based on official filings with the SEC.
Are insiders buying Ideal Power stock?
No, insiders are not buying Ideal Power shares – they are net sellers. Over the last 3 months, insiders have made 1 purchases and 6 sales. On a net basis, 505,185 $ worth of shares were sold. Across the last 20 reported transactions, the split is 7 purchases and 13 sales, with a net 139,857 $ sold. Active sellers include BURNS TIMOTHY, SOMO DAVID M, BRDAR DANIEL. Insider selling can have several explanations (e.g. planned 10b5-1 sales, portfolio diversification or taxes), but sustained selling by several insiders is worth watching closely.
Is Ideal Power a good stock?
Based on our total score, Ideal Power is rated as a disastrous stock with a total score of 10 out of 100. The stock scores very low on value, quality and momentum – it is among the worst in our database. The score is made up of Value: 11/100, Quality: 8/100, Momentum: 12/100. In addition: analysts see 151.2% upside to the price target; technical signal: Sell. Whether Ideal Power is a good investment depends on your time horizon, risk profile and portfolio. This is a data-driven observation, not investment advice.
What is the outlook for Ideal Power stock?
The outlook for Ideal Power based on current data: the average analyst price target is $10.75 (+151.2%); the stock is in a downtrend (below SMA50 and SMA200); the next earnings report is due on 8/13/2026, which can move the price. Keep in mind that stock prices are affected by many factors, including earnings reports, the economy and market sentiment. Past returns are no guarantee of future returns.
Why is Ideal Power stock rising?
Ideal Power is rising right now. The technical indicators show: the price is 4.2% above the 20-day average; insiders have mostly been selling the stock recently. For the latest context, see our technical analysis, insider section and news overview above.
How high can Ideal Power go?
The average analyst price target for Ideal Power is $10.75, which corresponds to a potential gain of 151.2% from the current price of $4.28. Keep in mind that price targets are estimates, not guarantees. Actual price moves depend on earnings, market conditions and unexpected events.
How low can Ideal Power fall?
We lack enough history to give a specific floor for Ideal Power. Remember: past price swings are no guarantee for the future — a stock can fall further than the last 52 weeks suggest, especially on profit warnings, sector crises or a market crash. Use stop-loss orders and spread your portfolio to limit losses in single stocks.
What does Ideal Power do?
Ideal Power Inc. tjener penge på at udvikle og sælge deres unikke B-TRAN teknologi. Kort sagt laver de en særlig type solid state switch, som de kalder Bi-directional bi-polar junction TRANsistorer. Det er en kernekomponent, der bruges i mange former for strømstyring. Ideal Po... The company belongs to the Industri sector, more specifically the Semiconductors industry, is headquartered in USA, and is traded on the USA Stocks. See the key figures, earnings history and price development above to evaluate Ideal Power as an investment.
Did Ideal Power raise or lower its guidance?
Over the last 60 days we have not registered a guidance raise or cut from Ideal Power. The company can still adjust its guidance at quarterly reports or between reports — see the earnings history and the news overview above.
Is Ideal Power making money or losing money?
We have no current profitability data for Ideal Power. See the latest report in the earnings history above.
Can Ideal Power go bankrupt?
The bankruptcy risk of Ideal Power is rated as elevated. Altman Z2 (a model for assessing financial distress) is -11.21 — that places the company in the weak zone. This is a probability based on the numbers, not a verdict — bankruptcy is not imminent. But the balance sheet is measurably weaker than average, so watch the debt, liquidity and possible capital raises. The Piotroski score (financial health 0-9, higher is better) is 2 — which is weak. Debt relative to equity is 11% (low). Remember: models like Altman Z2 are statistical — unexpected shocks (fraud, a sector collapse, lawsuits) can always happen. Spread your portfolio.
Does Ideal Power have a lot of debt?
No, Ideal Power has low debt relative to equity. The debt-to-equity ratio (D/E — interest-bearing debt to equity) is 11%. For the industri sector, anything below 80% counts as low debt. Note: D/E levels are highly sector-specific — a bank at 300% debt is normal, a tech stock at 300% is extremely leveraged. Always compare with similar companies in the same sector.