ExlService (EXLS.US) Price Target and Rating 2026/2027

43.12
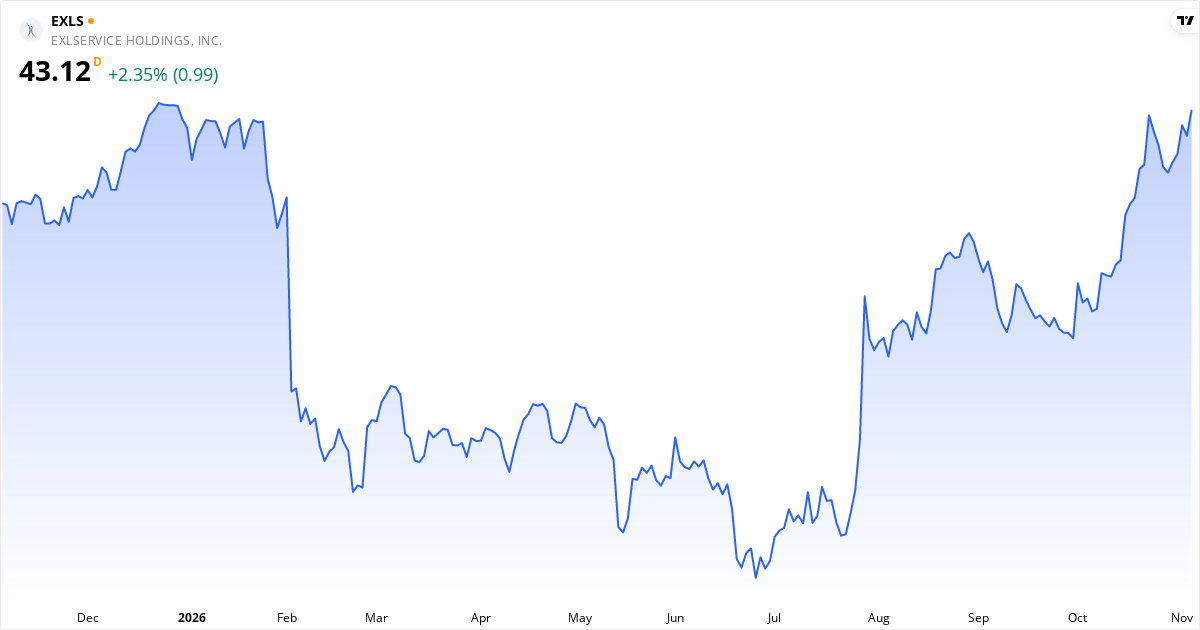
Price history for ExlService (EXLS.US) – stock price at $43.12, November 2026
ExlService stock price – price development 2026. Updated Nov 5, 2026.
Share this analysis:

ExlService Price Target 2026: Analysts See 13% Upside

The average price target for ExlService is $48.63. This price target represents the analysts' view of the stock price over the next 12 months. The stock may be undervalued, because the price target is higher than the current price. The stock is 12.78% below the target, which can point to potential returns within the next 12 months if the analysts' view proves right. Also consider the stock's valuation ratios such as P/E, P/S and P/B, plus the technical analysis further down the page, for the full picture.
⚠️ Don’t buy a stock just because of its price targetA price target is the analysts’ estimate of where the stock will trade in 12 months. That estimate is often wrong. A large study of US stocks from 2000 to 2009 found that only 38% of price targets had been met after 12 months. On average, the targets promised 15 percentage points more return than the stocks delivered. Use the price target together with the financials and the trend, not on its own.Source: Bradshaw, Brown and Huang (2013)

Is ExlService overvalued or undervalued?

ExlService is currently undervalued with a gap of 12.8% relative to the price target.


The current price is $43.12, which places ExlService in the undervalued category. The stock is considered undervalued when the price is below $43.77, and overvalued when the price exceeds $53.49.


The fair value range is defined as ±10% of the price target, because price targets are estimates rather than exact values. For ExlService, the fair value range lies between $43.77 and $53.49.


See the full price target analysis for ExlService →

Analyst Ratings for ExlService stock in 2026: Strong Buy

9 analysts cover ExlService. There is broad agreement on a positive view — 100% recommend buying. The average price target is $48.63, which gives an upside of 12.8% from the current price.

Consensus: Strong Buy (4.67/5)
Strong Buy
6 (66.7%)
Buy
3 (33.3%)
Strong Sell Sell Hold Buy Strong Buy
4.67 out of 5 based on 9 analysts

About ExlService – Information Technology Services

ExlService Holdings, Inc., operates as a data and artificial intelligence ("AI") company in the North America, the United Kingdom, Europe, and internationally. The company operates through Insurance; Healthcare and Life Sciences; Banking, Capital Markets, and Diversified Industries; and International Growth Markets. It provides digital operations and solutions and analytics-driven services, such as claims management, premium and benefit administration, agency management, account reconciliation, actuarial and risk analytics, policy research, digital marketing, underwriting support, new business acquisition, policy servicing, audit, surveys, billing and collection, commercial and residential survey, and customer service; digital customer acquisition services using a software-as-a-service delivery model through LifePRO and Life Digital Suite platforms; and Subrosource software platform, an end-to-end subrogation platform. The company also offers health care services for care, utilization, and disease management; payment integrity; revenue optimization, customer engagement, and commercial analytics and regulatory support services; and digital operations and solutions. In addition, it provides financial planning and analysis, accounting, regulatory and statutory reporting, decision support, data management, and compliance services; consumer and commercial banking, credit card and payment services; fintech, wealth and retirement services; capital markets, utilities, retail and consumer packaged goods, communications, media and entertainment, travel and leisure, transportation and logistics, infrastructure, and other business services; property and casualty insurance, life insurance, disability insurance; and insurance brokers, reinsurers, annuity and retirement services. The company was founded in 1999 and is headquartered in New York, New York. Read more about the company

Key Figures for ExlService

$6.4B Market cap
$2.3B Revenue
Information Technology Services Industry
25.23 P/E
2.71 P/S
6.91 P/B
United States Listed on exchange

What kind of stock is ExlService?

Growth stock Momentum stock

ExlService is classified as a growth stock and momentum stock. This means the stock combines several attractive traits, and strong price momentum.

Score Overview for ExlService

💰 Value Score 43/100 (Neutral)
⭐ Quality Score 59/100 (Neutral)
🚀 Momentum Score 97/100 (Very High)
📊 Total Score 66/100

📈 Valuation

ExlService trades at a P/E ratio of 25.2, which is above the market average. The forward P/E is 15.7 (38% lower), which suggests the market expects rising earnings. The P/S ratio is 2.7. The P/B ratio is 6.9. The PEG ratio is 0.98 — below 1.0 suggests the stock is cheap relative to its growth rate.

💵 Profitability & Growth

ExlService has a profit margin of 11.1% (solid) and an operating margin of 14.1%. Return on equity (ROE) is 27.7% — excellent return on equity. Return on assets (ROA) is 11.4%. The latest quarterly earnings grew 25.0% year over year.

🏦 Financial Health

The Piotroski score is 6 out of 9 — good financial health. Altman Z2 is 6.40 (healthy balance sheet — low risk). The debt-to-equity ratio (D/E) is 74.0% — low debt, a solid balance sheet.

🚀 Momentum & Short Interest

Short interest is 7.77% — elevated, some investors are betting on a decline.

Insider Trading in ExlService 2026: Only sells

In 2026, insiders at ExlService have made 20 transactions, all of which were sales. On a net basis, insiders took $6,098,388 out of the stock. Active insiders include Bhalla Vikas, Chhibbar Vishal, AYYAPPAN AJAY and others. Over the last 3 months: only sells.

Last 3 Months: Only sells

Insiders have exclusively sold shares over the last 3 months.

Over the last 3 months: 0 purchases and 3 sales. A net $946,380 out of the stock.

All Transactions: Only sells

Insiders have exclusively sold shares in the recent period. This can suggest management sees limited opportunity.

Across the last 20 transactions: 0 purchases and 20 sales. A net $6,098,388 out of the stock.

Latest sale: Bhalla Vikas sold 11,000 shares at $35.38 each on 2026-10-01.

Who is selling: Bhalla Vikas, Chhibbar Vishal, AYYAPPAN AJAY, STUDENMUND JAYNIE M, Mahon Anita.

Latest Insider Trades in ExlService (2026)

The table shows the last 20 reported insider transactions in ExlService. Green rows are purchases, red rows are sales. The data is based on official filings.

Transaction date Name Type Number of shares Price per share ($) Total amount ($)
2026-10-01 Bhalla Vikas Sell 11,000 35 389,180
2026-09-01 Bhalla Vikas Sell 10,000 38 381,700
2026-08-11 Chhibbar Vishal Sell 5,000 35 175,500
2026-08-03 Bhalla Vikas Sell 11,000 35 384,890
2026-07-01 Bhalla Vikas Sell 12,000 26 317,640
2026-06-04 Bhalla Vikas Sell 12,000 30 362,640
2026-05-20 AYYAPPAN AJAY Sell 5,093 29 148,257
2026-03-02 AYYAPPAN AJAY Sell 1,679 30 51,025
2026-02-23 AYYAPPAN AJAY Sell 1,197 30 35,659
2026-02-18 AYYAPPAN AJAY Sell 1,226 30 37,172

Who is buying and selling ExlService shares in 2026?

The following insiders have sold shares: Bhalla Vikas, Chhibbar Vishal, AYYAPPAN AJAY, STUDENMUND JAYNIE M, Mahon Anita. In total, $6,098,388 was sold across 20 transactions. Insider trades are legal transactions in which executives and board members buy or sell shares of their own company. These transactions are reported to the SEC and are publicly available.

ExlService Short Selling 2026: 7.8% Sold Short

High short interest: 7.8% of the free float
Short % of free float
7.8%
Assessment
High short interest
Short squeeze risk
Moderate
Data source
EODHD
Reported about twice a month
The stock has a high share of short selling. Between 5-10% of the freely traded shares are sold short, which suggests some investors are betting on falling prices. Positive surprises can lead to a moderate short squeeze.

What does this mean for you as an investor?
A short interest of 7.8% means that 7.8% of the freely traded shares in ExlService have been borrowed and sold by investors betting on falling prices.

Short interest comes from our data provider EODHD. The figure is reported about twice a month; we check it every trading day.
Short Interest Scale
0% 2% 5% 10% 20%+
Low Moderate High Very High Extreme
▲
7.8%

When Does ExlService Report Earnings?

The next earnings date for ExlService is not yet available. Check the company's investor calendar for more information.


Technical Analysis of ExlService 2026 – Signal: Strong Buy

Overall Technical Signal: Strong Buy

Based on trend analysis (SMA50/SMA200) and MACD trend (positive/negative on a daily + weekly basis). Updated November 5, 2026.

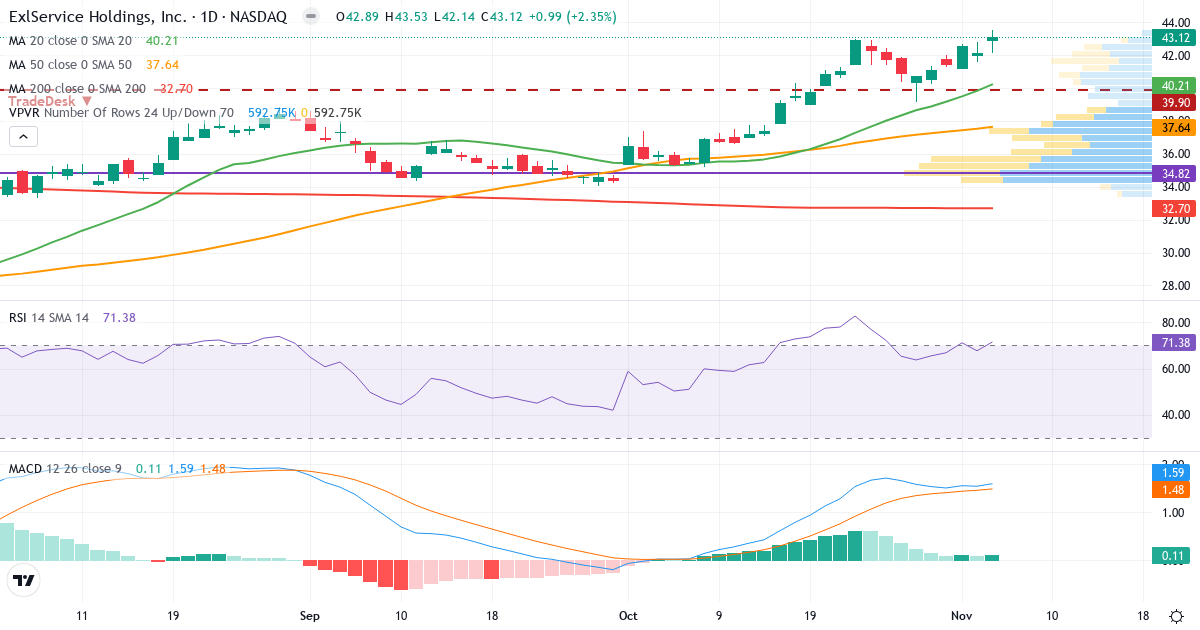
Technical analysis of ExlService (EXLS.US) – RSI 71, MACD positive (bullish), daily candlestick chart November 2026
ExlService technical analysis – candlestick chart with RSI, MACD and volume profile. Updated Nov 5, 2026.

Trend Analysis of ExlService Holdings, Inc

ExlService Holdings, Inc is in a short-term uptrend. The price of $43.12 is 7.2% above the 20-day average ($40.21). Medium term, the picture is positive: the price is 14.6% above the 50-day average ($37.64). Long term, the stock is 31.9% above the 200-day average ($32.70), which confirms a long-term uptrend.

Golden Cross: The 50-day average (37.64) is above the 200-day average (32.70), which is a classic bullish signal for ExlService Holdings, Inc.

Is ExlService Holdings, Inc overbought or oversold?

ExlService Holdings, Inc has an RSI of 71.4, which places the stock in overbought territory (above 70). Even though the stock is overbought, the broader trend is positive. A short-term pullback is possible, but the trend still supports the price.

MACD Analysis for ExlService Holdings, Inc

Daily MACD: MACD is positive (1.590), which means the short-term trend is bullish (the 12-day EMA is above the 26-day EMA). MACD is above the signal line (1.482) by 0.108, which confirms rising momentum in the uptrend.

Weekly MACD: MACD5 is positive (2.039), which indicates a broader bullish long-term trend. MACD5 is above the signal line (0.897) by 1.142, which confirms rising long-term momentum.

Overall MACD assessment: Both the daily and weekly MACD are positive and above their signal lines. Trend and momentum confirm each other across time horizons – the strongest bullish signal.

Risk Profile for ExlService Holdings, Inc

ExlService Holdings, Inc has an annual standard deviation of 42.0%, which classifies the stock as medium risk. The price can swing noticeably when the market moves.

Overall Technical Conclusion for ExlService Holdings, Inc

Trend: Positive. The price trades above SMA50 and SMA200.

MACD trend (zero line): Daily bullish (1.590). Weekly bullish (2.039).

MACD momentum (signal): Daily rising. Weekly rising.

RSI: 71.4 – overbought.

Technical signal: Strong Buy

The price is in an uptrend (above SMA50/SMA200) and MACD is positive on both a daily and weekly basis. Trend and MACD trend confirm each other – the strongest technical buy signal.

Who Owns ExlService?

The three largest owners of ExlService are BlackRock Inc (12.5%), FMR Inc (9.2%) and AQR Capital Management LLC (4.5%). The percentage is their share of the stock, as of Jun 30, 2026. Source: our data provider EODHD.

The 10 Largest Institutions

InstitutionStakeChange
BlackRock Inc12.52%−1.2%
FMR Inc9.21%+3.6%
AQR Capital Management LLC4.52%−31.0%
Vanguard Capital Management, LLC4.41%−1.4%
Vanguard Portfolio Management, LLC4.30%−0.3%
State Street Corp3.23%+1.6%
Geode Capital Management, LLC2.70%−3.5%
Two Sigma Investments LLC2.67%+8.4%
Geneva Capital Management2.28%−19.3%
D. E. Shaw & Co LP2.16%−5.4%

As of Jun 30, 2026. "Change" is the change in shares held since the holder's previous report.

The 5 Largest Funds

FundStakeChange
iShares Core S&P Mid-Cap ETF3.61%+0.1%
Vanguard MStar Total Stk Mkt Idx Invest3.06%−0.1%
Vanguard Small Cap Index2.15%−3.1%
Strategic Advisers Fidelity US TtlStk1.91%+0.2%
Fidelity Series Value Discovery1.57%0.0%

As of Oct 29, 2026. A fund may be managed by one of the institutions above, so the two lists cannot be added together.

Frequently Asked Questions About ExlService stock in 2026

Should you buy ExlService stock now?
Yes, the technical signal for ExlService is currently Strong Buy. ExlService trades at $43.12 as of Nov 5, 2026. The technical analysis shows the following: MACD is positive (bullish trend) at 1.590 with rising momentum (signal: 1.482); RSI is at 71.4 (overbought), suggesting the price may have risen too quickly; the stock is in a short-term uptrend (price above the 20-day average); the analyst price target of $48.63 points to 12.8% upside. The stock is in a broader uptrend (above SMA50/SMA200). This is a technical observation based on current data, not investment advice.
What is the price target for ExlService stock?
The average analyst price target for ExlService is $48.63. The current price is $43.12, which gives an upside of 12.8%. Based on this, the stock is considered undervalued. The fair value range (±10% of the price target) is between $43.77 and $53.49.
Is ExlService a dividend stock?
No, ExlService does not currently pay a dividend to shareholders. The company reinvests its profits in growth instead of paying dividends.
What is the risk of ExlService stock?
ExlService is rated as a stock in the risk category Moderate. the annual standard deviation is 42.0%, which classifies the stock as Moderate. In addition, an RSI of 71.4 signals overbought (elevated risk of a pullback).
Is ExlService overvalued?
No, ExlService is considered undervalued based on the analyst price target (12.8% upside). ExlService has the following valuation ratios: a P/E ratio of 25.2 (moderately to highly valued), a P/S ratio of 2.7, a P/B ratio of 6.9. The analyst price target suggests that the stock is undervalued by 12.8%.
Is ExlService overbought?
Yes, ExlService is overbought with an RSI of 71.4 (above 70). The technical indicators show: RSI is at 71.4 (above the 70 mark), which signals the price is overbought and may have risen too quickly. In addition, the price is 7.2% above the 20-day average (short-term uptrend). In addition, MACD is positive with rising momentum (bullish).
When is the next ExlService earnings report?
The date of the next earnings report for ExlService has not been published yet. Check the company's investor calendar for updates.
Is ExlService shorted?
Yes, ExlService is shorted with 7.8% of the free float sold short. This is a high level of short selling, which suggests some investors are betting on falling prices. Positive surprises can lead to a moderate short squeeze. The figure comes from our data provider EODHD, is reported about twice a month, and we check it every trading day.
Are insiders buying ExlService stock?
No, insiders are not buying ExlService shares – they are net sellers. Over the last 3 months, insiders have made 0 purchases and 3 sales. On a net basis, 946,380 $ worth of shares were sold. Across the last 20 reported transactions, the split is 0 purchases and 20 sales, with a net 6,098,388 $ sold. Active sellers include Bhalla Vikas, Chhibbar Vishal, AYYAPPAN AJAY and others. Insider selling can have several explanations (e.g. planned 10b5-1 sales, portfolio diversification or taxes), but sustained selling by several insiders is worth watching closely.
Is ExlService a good stock?
Based on our total score, ExlService is rated as a good stock with a total score of 66 out of 100. The stock scores above average on value, quality and momentum. The score is made up of Value: 43/100, Quality: 59/100, Momentum: 97/100. In addition: analysts see 12.8% upside to the price target. Whether now is the time to buy is a separate question: the technical signal is Strong Buy. Whether ExlService is a good investment depends on your time horizon, risk profile and portfolio. This is a data-driven observation, not investment advice.
What is the outlook for ExlService stock?
The outlook for ExlService based on current data: the average analyst price target is $48.63 (+12.8%); the stock is in an uptrend (above SMA50 and SMA200); the P/E ratio is 25.2 (moderate). Keep in mind that stock prices are affected by many factors, including earnings reports, the economy and market sentiment. Past returns are no guarantee of future returns.
Why is ExlService stock rising?
ExlService is rising right now. The technical indicators show: the price is 7.2% above the 20-day average; MACD is positive with rising momentum (bullish signal); short interest is 7.8% (high – many are betting on a decline); insiders have mostly been selling the stock recently. For the latest context, see our technical analysis and insider section above.
How high can ExlService go?
The average analyst price target for ExlService is $48.63, which corresponds to a potential gain of 12.8% from the current price of $43.12. The stock has traded between $24.85 and $43.88 over the last 52 weeks. The price is close to the 52-week high. Keep in mind that price targets are estimates, not guarantees. Actual price moves depend on earnings, market conditions and unexpected events.
How low can ExlService fall?
The stock has traded as low as $24.85 over the last 52 weeks — that is 42.4% below the current price of $43.12. The biggest decline (drawdown) in the same period was 43.4% from high to low. Within a year, the price typically swings about ±42.0% (standard deviation — a measure of price swings). A difficult year could therefore mean a further decline of that size. Remember: past price swings are no guarantee for the future — a stock can fall further than the last 52 weeks suggest, especially on profit warnings, sector crises or a market crash. Use stop-loss orders and spread your portfolio to limit losses in single stocks.
What does ExlService do?
ExlService Holdings, Inc., operates as a data and artificial intelligence ("AI") company in the North America, the United Kingdom, Europe, and internationally. The company operates through Insurance; Healthcare and Life Sciences; Banking, Capital Markets, and Diversified Indus... The company belongs to the Technology sector, more specifically the Information Technology Services industry, is headquartered in United States, and is traded on the USA Stocks. See the key figures, earnings history and price development above to evaluate ExlService as an investment.
Did ExlService raise or lower its guidance?
Over the last 60 days we have not registered a guidance raise or cut from ExlService. The company can still adjust its guidance at quarterly reports or between reports — see the earnings history above.
Is ExlService making money or losing money?
Yes, ExlService is making money, not losing it. The company has a profit margin (the share of revenue left over as profit) of 11.1% — which is solid. The operating margin (profit before interest and taxes) is 14.1%. At a P/E ratio of 25.2, you currently pay 25.2 dollars for every dollar of the company's annual earnings. A consistently profitable company is usually more resilient than growth stocks that are not yet making money.
Can ExlService go bankrupt?
The bankruptcy risk of ExlService is rated as low. Altman Z2 (a model for assessing financial distress) is 6.40 — that places the company in the healthy zone. The company has a healthy balance sheet with limited debt relative to earnings and assets. The Piotroski score (financial health 0-9, higher is better) is 6 — which is average. Debt relative to equity is 74% (moderate). Remember: models like Altman Z2 are statistical — unexpected shocks (fraud, a sector collapse, lawsuits) can always happen. Spread your portfolio.
Does ExlService have a lot of debt?
ExlService has moderate debt relative to equity. The debt-to-equity ratio (D/E — interest-bearing debt to equity) is 74%. For the technology sector, 60-120% counts as a typical level. Tech companies are usually asset-light and need little borrowed capital — anything below 60% counts as low in this sector. Note: D/E levels are highly sector-specific — a bank at 300% debt is normal, a tech stock at 300% is extremely leveraged. Always compare with similar companies in the same sector. Can ExlService service its debt? Can service its debt without problems — the interest coverage ratio (how many times earnings can cover interest payments) is 14.7x, and net debt equals 1.2 years of earnings (EBITDA).
Other Stocks in Technology

Compare ExlService with other stocks in the technology sector. Click a stock to see its technical analysis, insider trading and key figures.

See all 219 stocks in the Technology sector