Joint Stock Company Kaspi.kz (KSPI.US) Price Target and Rating 2026/2027
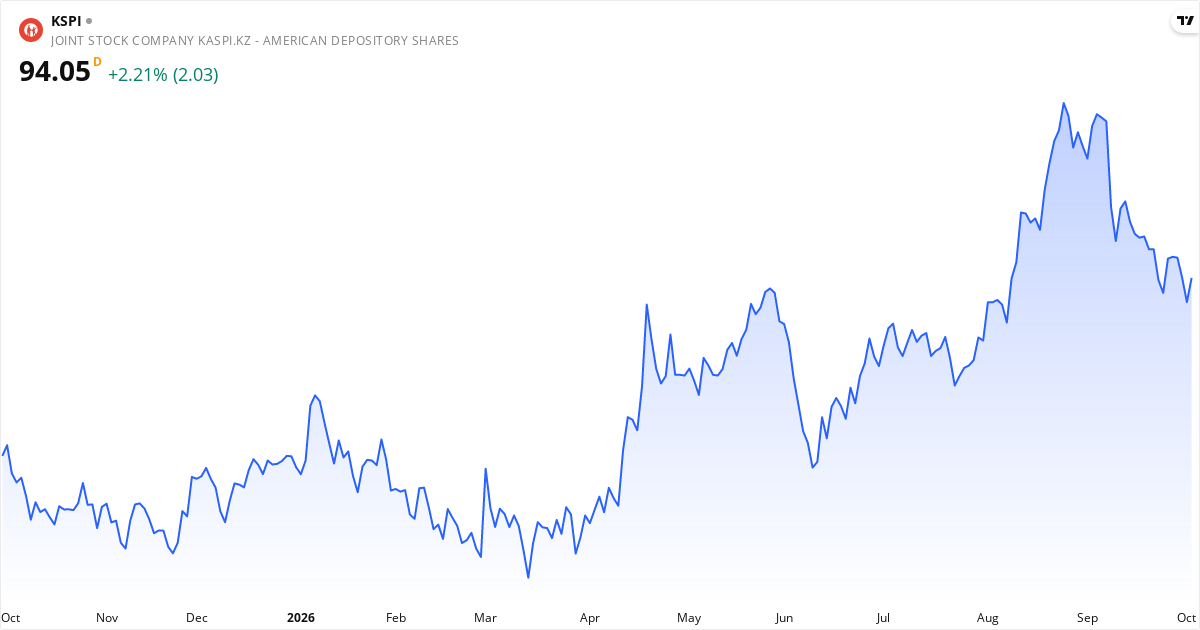
Joint Stock Company Kaspi.kz 2026 Price Target
The average price target for Joint Stock Company Kaspi.kz is $107.89. This price target represents the analysts' view of the stock price over the next 12 months. The stock may be undervalued, because the price target is higher than the current price. The stock is 0% below the target, which can point to potential returns within the next 12 months if the analysts' view proves right. Also consider the stock's valuation ratios such as P/E, P/S and P/B, plus the technical analysis further down the page, for the full picture.Is Joint Stock Company Kaspi.kz overvalued or undervalued?
Joint Stock Company Kaspi.kz is currently fairly valued with a gap of 0% relative to the price target.
The current price is $0.00, which places Joint Stock Company Kaspi.kz in the fairly valued category. The stock is considered undervalued when the price is below $97.10, and overvalued when the price exceeds $118.68.
The fair value range is defined as ±10% of the price target, because price targets are estimates rather than exact values. For Joint Stock Company Kaspi.kz, the fair value range lies between $97.10 and $118.68.
See the full price target analysis for Joint Stock Company Kaspi.kz →
Analyst Ratings for Joint Stock Company Kaspi.kz stock in 2026: Buy
7 analysts cover Joint Stock Company Kaspi.kz. The ratings are mixed, with 57.1% Buy, 42.9% Hold and 0% Sell.
About Joint Stock Company Kaspi.kz – Software - Infrastructure
Joint Stock Company Kaspi.kz, together with its subsidiaries, provides payments, marketplace, and fintech solutions for consumers and merchants in Kazakhstan, Azerbaijan, and Ukraine. The company operates through three segments: Payments, Marketplace, and Fintech. The Payments segment offers a platform that facilities transactions between and among merchants and consumers. This segment provides ways for consumers to pay for shopping transactions and regular household bills, as well as make peer to peer payments; and enables merchants to accept payment online and in store, issue and settle invoices, pay suppliers, and monitor merchant turnover. It also offers proprietary data, which facilitates informed decision-making across multiple areas of business. Its Marketplace Platform segment connects both online and offline merchants with consumers, enabling merchants to increase sales through an omnichannel strategy and allowing consumers to purchase products and services from various merchants. This segment operates marketplaces through m-commerce, a mobile solution for shopping in person; e-Commerce, which allows consumers to shop anywhere and anytime with free delivery; and Kaspi Travel that allows consumers to book domestic and international flights, domestic rail tickets, and international package holidays. It also enhances merchants' sales by connecting payments and fintech products, Kapsi advertising, and other delivery services. The Fintech Platform segment provides consumers with buy-now-pay-later, finance and savings products, and merchants with merchant finance services. It also involved in the banking; distressed asset management; real estate business; payment processing; online travel; e-grocery; classifieds; and storage and processing of information services. Joint Stock Company Kaspi.kz was incorporated in 2008 and is headquartered in Almaty, the Republic of Kazakhstan. Read more about the companyKey Figures for Joint Stock Company Kaspi.kz
What kind of stock is Joint Stock Company Kaspi.kz?
Joint Stock Company Kaspi.kz is classified as a value stock and momentum stock. This means the stock combines several attractive traits, and strong price momentum.
Score Overview for Joint Stock Company Kaspi.kz
📈 Valuation
Joint Stock Company Kaspi.kz trades at a P/E ratio of 7.7, which is below the market average and can point to an attractive price. The P/S ratio is 1.9. The P/B ratio is 3.1.
💵 Profitability & Growth
Joint Stock Company Kaspi.kz has a profit margin of 24.2% (excellent). Return on equity (ROE) is 44.8% — excellent return on equity. Return on assets (ROA) is 13.5%. The latest quarterly earnings grew 0.2% year over year.
🏦 Financial Health
The Piotroski score is 6 out of 9 — good financial health. Altman Z2 is 2.91 (healthy balance sheet — low risk). The debt-to-equity ratio (D/E) is 448.5% — high debt, which raises the risk.
🚀 Momentum & Short Interest
Short interest is 0.83% — low, the market does not expect a decline.
When Does Joint Stock Company Kaspi.kz Report Earnings – Next Date: Nov 9, 2026
The next earnings report from Joint Stock Company Kaspi.kz is scheduled for November 9, 2026. This report covers the third quarter (Q3), which ended on September 30, 2026.Technical Analysis of Joint Stock Company Kaspi.kz 2026 – Signal: Hold
Based on trend analysis (SMA50/SMA200) and MACD trend (positive/negative on a daily + weekly basis). Updated October 4, 2026.
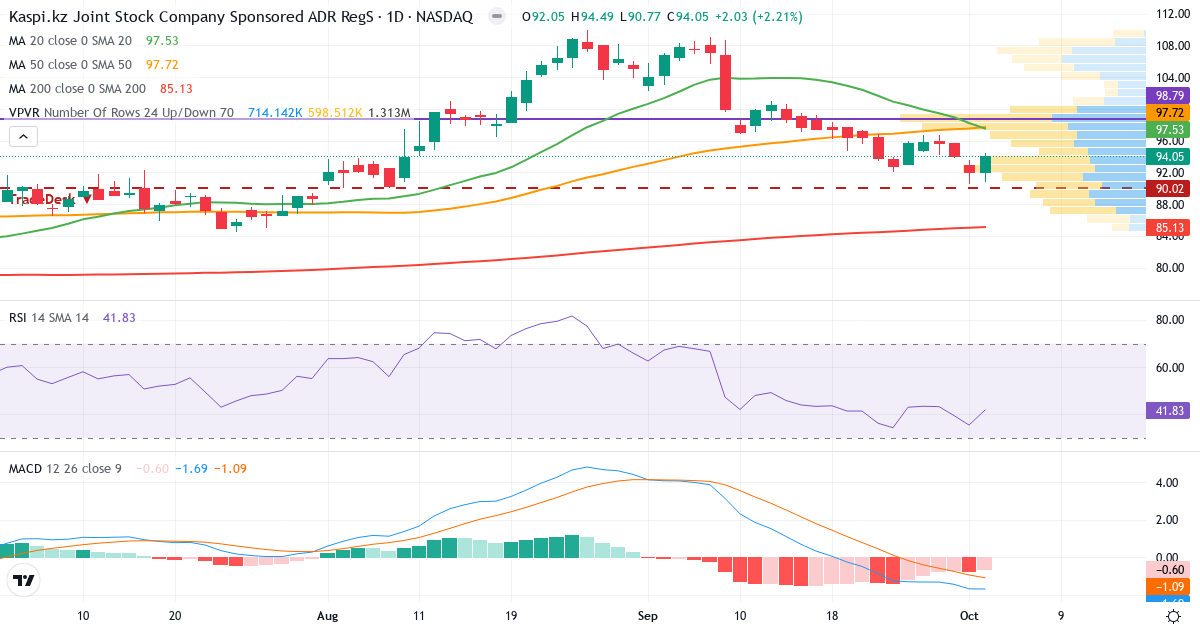
Trend Analysis of Joint Stock Company Kaspi.kz
Joint Stock Company Kaspi.kz is in a short-term downtrend. The price of $94.05 is 3.2% below the 20-day average ($97.19). Medium term, the picture is negative: the price is 2.4% below the 50-day average ($96.32). Long term, the stock is 15.0% above the 200-day average ($81.80), which confirms a long-term uptrend.
Golden Cross: The 50-day average (96.32) is above the 200-day average (81.80), which is a classic bullish signal for Joint Stock Company Kaspi.kz.
Is Joint Stock Company Kaspi.kz overbought or oversold?
Joint Stock Company Kaspi.kz has an RSI of 43.2. The stock sits in the lower part of the neutral zone, which points to weak momentum without being oversold.
MACD Analysis for Joint Stock Company Kaspi.kz
Daily MACD: MACD is negative (-1.225), which means the short-term trend is bearish (the 12-day EMA is below the 26-day EMA). MACD is below the signal line (-0.585) by 0.640, which confirms growing negative momentum in the downtrend.
Weekly MACD: MACD5 is positive (5.432), which indicates a broader bullish long-term trend. MACD5 is above the signal line (5.199) by 0.233, which confirms rising long-term momentum.
Overall MACD assessment: The daily and weekly MACD give conflicting signals. The long-term trend is bullish, but the short-term trend is bearish. Short-term momentum is still falling – a deeper pullback is possible.
Risk Profile for Joint Stock Company Kaspi.kz
Joint Stock Company Kaspi.kz has an annual standard deviation of 0.0%, which classifies the stock as Conservative. Price swings are limited, and the stock suits conservative investors.
Overall Technical Conclusion for Joint Stock Company Kaspi.kz
Trend: Neutral/mixed.
MACD trend (zero line): Daily bearish (-1.225). Weekly bullish (5.432).
MACD momentum (signal): Daily falling. Weekly rising.
RSI: 43.2 – neutral.
Technical signal: Hold
The signals are mixed – trend and MACD point in different directions. Wait until MACD crosses the zero line in the direction of the trend before acting.
Frequently Asked Questions About Joint Stock Company Kaspi.kz stock in 2026
Should you buy Joint Stock Company Kaspi.kz stock now?
What is the price target for Joint Stock Company Kaspi.kz stock?
Is Joint Stock Company Kaspi.kz a dividend stock?
What is the risk of Joint Stock Company Kaspi.kz stock?
Is Joint Stock Company Kaspi.kz overvalued?
Is Joint Stock Company Kaspi.kz overbought?
When is the next Joint Stock Company Kaspi.kz earnings report?
Is Joint Stock Company Kaspi.kz shorted?
Are insiders buying Joint Stock Company Kaspi.kz stock?
Is Joint Stock Company Kaspi.kz a good stock?
What is the outlook for Joint Stock Company Kaspi.kz stock?
Why is Joint Stock Company Kaspi.kz stock moving?
How high can Joint Stock Company Kaspi.kz go?
How low can Joint Stock Company Kaspi.kz fall?
What does Joint Stock Company Kaspi.kz do?
Did Joint Stock Company Kaspi.kz raise or lower its guidance?
Is Joint Stock Company Kaspi.kz making money or losing money?
Can Joint Stock Company Kaspi.kz go bankrupt?
Does Joint Stock Company Kaspi.kz have a lot of debt?
Other Stocks in Technology
Compare Joint Stock Company Kaspi.kz with other stocks in the technology sector. Click a stock to see its technical analysis, insider trading and key figures.
See all 204 stocks in the Technology sector