Ostin Technology (OST.US) – Strong Sell: Rating and Stock Analysis 2026/2027
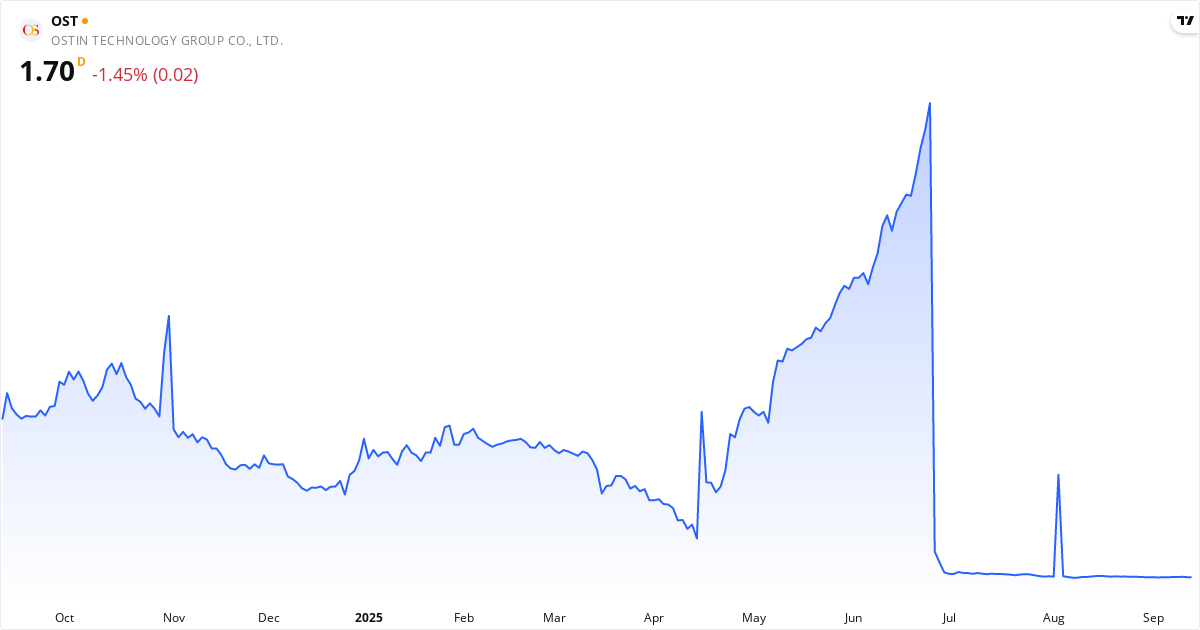
No analysts currently cover Ostin Technology with a public price target. We add the price target automatically as soon as at least one analyst publishes a rating. Until then, use the technical analysis and the key figures below.
About Ostin Technology – Electronic Components
Ostin Technology Group Co., Ltd., through its subsidiaries, designs, develops, and manufactures thin-film transistor liquid crystal display (TFT-LCD) modules and polarizers in Mainland China, Hong Kong, Taiwan, and internationally. The company offers display modules to markets, such as consumer electronics, including all-in-one computers, monitors, laptop computers, and tablets; automotive displays, including dashboard, and navigation and multimedia systems; and commercial LCD displays, which are used to display multimedia graphics, such as company advertisements, promotions, scoreboards, and traffic signs in the medical treatment, education, business, outdoor, and cultural construction industries. It also provides all-in-one intelligent conference system and Pintura wireless photo transmission systems. The company sells its products directly to customers, such as display panel manufacturers; and to customers' designated system integrators through e-commerce platforms, new media business, and offline stores. Ostin Technology Group Co., Ltd. was founded in 2010 and is headquartered in Nanjing, China. Read more about the companyKey Figures for Ostin Technology
What kind of stock is Ostin Technology?
Ostin Technology is classified as a speculative stock.
Score Overview for Ostin Technology
📈 Valuation
The P/S ratio is 0.3 (low — potentially undervalued relative to revenue). The P/B ratio is 3.4.
💵 Profitability & Growth
The latest quarterly earnings grew -16.1% year over year — falling earnings.
🏦 Financial Health
The Piotroski score is 1 out of 9 — weak financial health, be careful. Altman Z2 is -6.94 (weak balance sheet — elevated risk). The debt-to-equity ratio (D/E) is 831.8% — high debt, which raises the risk.
🚀 Momentum & Short Interest
Short interest is 2.96%.
Ostin Technology Short Selling 2026: 3.0% Sold Short
Data is updated daily based on official filings with the SEC.
When Does Ostin Technology Report Earnings?
The next earnings date for Ostin Technology is not yet available. Check the company's investor calendar for more information.Technical Analysis of Ostin Technology 2026 – Signal: Strong Sell
Based on trend analysis (SMA50/SMA200) and MACD trend (positive/negative on a daily + weekly basis). Updated August 6, 2026.
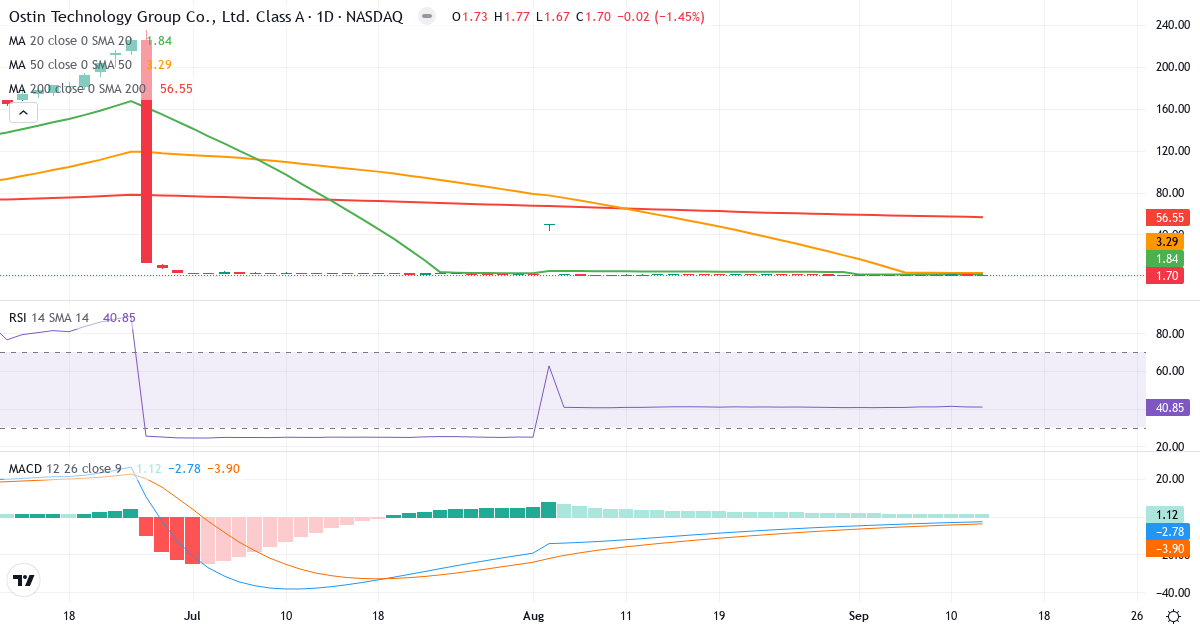
Trend Analysis of Ostin Technology Group Co Ltd
Ostin Technology Group Co Ltd is in a short-term uptrend. The price of $1.70 is 0.0% above the 20-day average ($1.70). Medium term, the picture is negative: the price is 0.0% below the 50-day average ($1.70). Long term, the stock is 0.0% below the 200-day average ($1.70), which signals a long-term downtrend.
Death Cross: The 50-day average (1.70) is below the 200-day average (1.70), which is a classic bearish signal for Ostin Technology Group Co Ltd.
Is Ostin Technology Group Co Ltd overbought or oversold?
Ostin Technology Group Co Ltd has an RSI of 28.1, which places the stock in oversold territory (below 30). WARNING: Oversold in a downtrend is NOT a buy signal. When the trend is negative, RSI can stay oversold for a long time while the price keeps falling. Wait for a trend reversal before buying.
MACD Analysis for Ostin Technology Group Co Ltd
Daily MACD: MACD is negative (0.000), which means the short-term trend is bearish (the 12-day EMA is below the 26-day EMA). MACD is below the signal line (0.000) by 0.000, which confirms growing negative momentum in the downtrend.
Weekly MACD: MACD5 is negative (-1.318), which indicates a broader bearish long-term trend. MACD5 is above the signal line (-1.974) by 0.656, which suggests the negative long-term momentum is fading – a bigger trend reversal could be ahead.
Overall MACD assessment: Both the daily and weekly trend are bearish (MACD negative). However, momentum shows signs of improving on a weekly basis – a potential trend reversal could be ahead, but it is not confirmed yet.
Risk Profile for Ostin Technology Group Co Ltd
Ostin Technology Group Co Ltd has an annual standard deviation of 40.7%, which classifies the stock as medium risk. The price can swing noticeably when the market moves.
Overall Technical Conclusion for Ostin Technology Group Co Ltd
Trend: Negative. The price trades below .
MACD trend (zero line): Daily bearish (0.000). Weekly bearish (-1.318).
MACD momentum (signal): Daily falling. Weekly rising.
RSI: 28.1 – oversold.
Technical signal: Strong Sell
The price is in a downtrend (below SMA50/SMA200) and MACD is negative on both a daily and weekly basis. Avoid buying and consider closing existing positions.