Texas Instruments (TXN.US) Price Target and Rating 2026/2027

Texas Instruments 2026 Price Target
The average price target for Texas Instruments is $336.86. This price target represents the analysts' view of the stock price over the next 12 months. The stock may be undervalued, because the price target is higher than the current price. The stock is 0% below the target, which can point to potential returns within the next 12 months if the analysts' view proves right. Also consider the stock's valuation ratios such as P/E, P/S and P/B, plus the technical analysis further down the page, for the full picture.Is Texas Instruments overvalued or undervalued?
Texas Instruments is currently fairly valued with a gap of 0% relative to the price target.
The current price is $0.00, which places Texas Instruments in the fairly valued category. The stock is considered undervalued when the price is below $303.17, and overvalued when the price exceeds $370.55.
The fair value range is defined as ±10% of the price target, because price targets are estimates rather than exact values. For Texas Instruments, the fair value range lies between $303.17 and $370.55.
Analyst Ratings for Texas Instruments stock in 2026: Buy
35 analysts cover Texas Instruments. The ratings are mixed, with 57.1% Buy, 37.1% Hold and 5.7% Sell.
About Texas Instruments – Semiconductors
Texas Instruments Incorporated designs, manufactures, and sells semiconductors to electronics designers and manufacturers in the United States, China, the rest of Asia, Europe, the Middle East, Africa, Japan, and internationally. It operates through Analog and Embedded Processing segments. The Analog segment offers power products to manage power requirements across various voltage levels, including battery-management solutions, DC/DC switching regulators, AC/DC and isolated controllers and converters, power switches, linear regulators, voltage references, multiphase controllers and power stages, and lighting products. This segment also provides signal chain products that sense, condition, and measure real-world signals and convert them into data to be transferred or converted for further processing and control, such as amplifiers, data converters, interface products, motor drives, clocks, and logic and sensing products. The Embedded Processing segment offers microcontrollers, processors, wireless connectivity, and radar products; and applications processors for specific computing activity. It also provides DLP products primarily for use in projecting high-definition images; calculators; and application-specific integrated circuits. Its products are used in various markets, such as industrial, automotive, personal electronics, communications equipment, enterprise systems, calculators, and others. The company markets and sells its semiconductor products through direct sales and distributors, as well as through its website. Texas Instruments Incorporated was founded in 1930 and is headquartered in Dallas, Texas. Read more about the companyKey Figures for Texas Instruments
What kind of stock is Texas Instruments?
Texas Instruments is classified as a growth stock and quality stock. This means the stock combines several attractive traits, strong financial health (Piotroski 9/9).
Score Overview for Texas Instruments
📈 Valuation
Texas Instruments trades at a P/E ratio of 40.1, which is above the market average. The forward P/E is 26.2 (35% lower), which suggests the market expects rising earnings. The P/S ratio is 13.6 (high — the market pays a premium for the revenue). The P/B ratio is 14.2. The PEG ratio is 0.90 — below 1.0 suggests the stock is cheap relative to its growth rate.
💵 Profitability & Growth
Texas Instruments has a profit margin of 34.3% (excellent) and an operating margin of 47.6%. Return on equity (ROE) is 39.7% — excellent return on equity. Return on assets (ROA) is 14.9%. The latest quarterly earnings grew 77.0% year over year — strong growth.
🏦 Financial Health
The Piotroski score is 9 out of 9 — excellent financial health. Altman Z2 is 10.00 (healthy balance sheet — low risk). The debt-to-equity ratio (D/E) is 110.1% — moderate debt.
🚀 Momentum & Short Interest
Short interest is 2.49%.
Texas Instruments Dividend
How much does Texas Instruments pay in dividends?
Texas Instruments does not currently pay a dividend. This may be because the company reinvests its profits in growth, or because there is not enough profit for dividend payments. You can find more information about the dividend policy on the company's website.
Historical Dividend Payments for Texas Instruments
No historical dividend payments are registered for this stock.
| Ex-date | Payment date | Amount | Currency |
|---|---|---|---|
| No historical dividend payments available. | |||
Texas Instruments Short Selling 2026: 2.5% Sold Short
Short interest comes from our data provider EODHD. The figure is reported about twice a month; we check it every trading day.
When Does Texas Instruments Report Earnings?
The next earnings date for Texas Instruments is not yet available. Check the company's investor calendar for more information.Technical Analysis of Texas Instruments 2026 – Signal: Buy
Based on trend analysis (SMA50/SMA200) and MACD trend (positive/negative on a daily + weekly basis). Updated October 28, 2026.
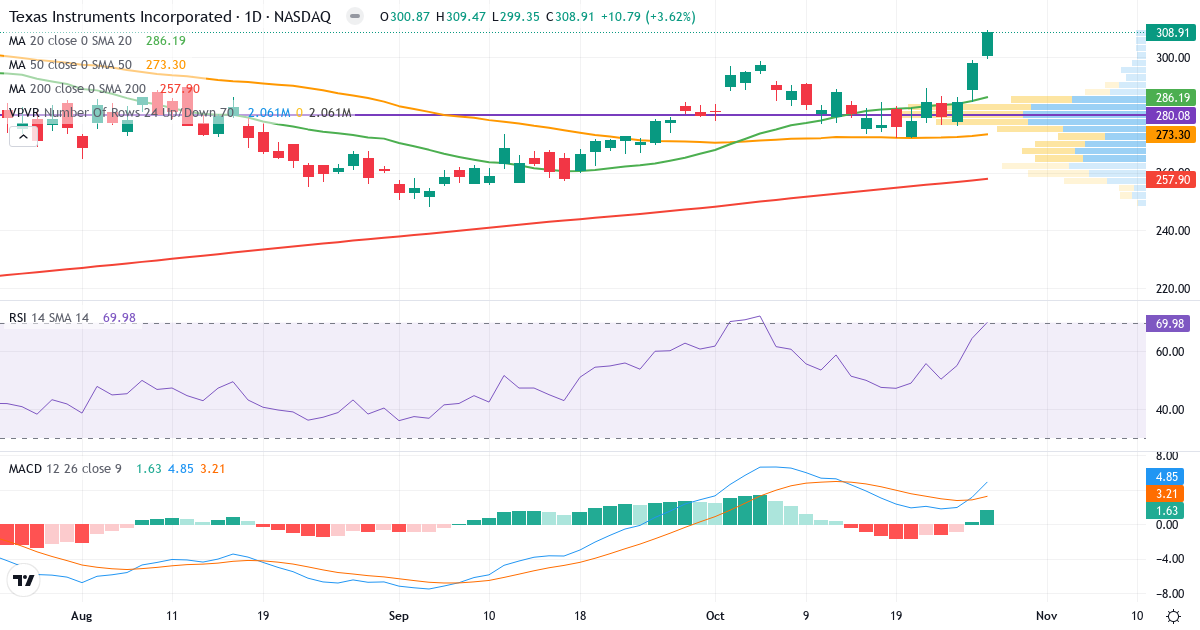
Trend Analysis of Texas Instruments Incorporated
Texas Instruments Incorporated is in a short-term uptrend. The price of $308.91 is 7.9% above the 20-day average ($286.19). Medium term, the picture is positive: the price is 13.0% above the 50-day average ($273.30). Long term, the stock is 20.4% above the 200-day average ($256.52), which confirms a long-term uptrend.
Golden Cross: The 50-day average (273.30) is above the 200-day average (256.52), which is a classic bullish signal for Texas Instruments Incorporated.
Is Texas Instruments Incorporated overbought or oversold?
Texas Instruments Incorporated has an RSI of 70.0. The stock shows positive momentum in the upper part of the neutral zone.
MACD Analysis for Texas Instruments Incorporated
Daily MACD: MACD is positive (4.859), which means the short-term trend is bullish (the 12-day EMA is above the 26-day EMA). MACD is above the signal line (3.230) by 1.629, which confirms rising momentum in the uptrend.
Weekly MACD: MACD5 is positive (9.436), which indicates a broader bullish long-term trend. MACD5 is below the signal line (11.374) by 1.938, which suggests the long-term momentum is fading – the positive trend could come under pressure.
Overall MACD assessment: Both the daily and weekly trend are bullish (MACD positive). However, momentum shows signs of weakening on a weekly basis. Watch whether the trend holds.
Overall Technical Conclusion for Texas Instruments Incorporated
Trend: Neutral/mixed.
MACD trend (zero line): Daily bullish (4.859). Weekly bullish (9.436).
MACD momentum (signal): Daily rising. Weekly falling.
RSI: 70.0 – neutral.
Technical signal: Buy
The broader trend is positive and MACD supports the picture. Consider buying with a stop-loss below the nearest support level.
Frequently Asked Questions About Texas Instruments stock in 2026
Should you buy Texas Instruments stock now?
What is the price target for Texas Instruments stock?
Is Texas Instruments a dividend stock?
What is the risk of Texas Instruments stock?
Is Texas Instruments overvalued?
Is Texas Instruments overbought?
When is the next Texas Instruments earnings report?
Is Texas Instruments shorted?
Are insiders buying Texas Instruments stock?
Is Texas Instruments a good stock?
What is the outlook for Texas Instruments stock?
Why is Texas Instruments stock moving?
How high can Texas Instruments go?
How low can Texas Instruments fall?
What does Texas Instruments do?
Did Texas Instruments raise or lower its guidance?
Is Texas Instruments making money or losing money?
Can Texas Instruments go bankrupt?
Does Texas Instruments have a lot of debt?
Other Stocks in Technology
Compare Texas Instruments with other stocks in the technology sector. Click a stock to see its technical analysis, insider trading and key figures.
See all 214 stocks in the Technology sector