Flex LNG (FLNG.US) Dividend 2026/2027: 10.5% – Price Target and Rating
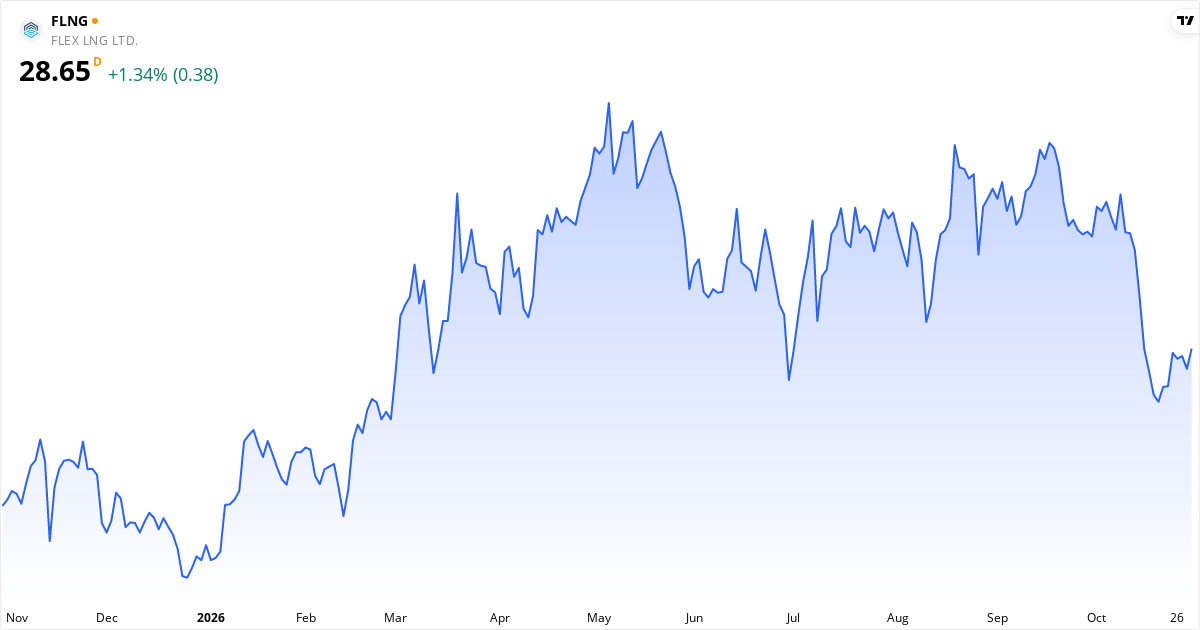
Flex LNG Price Target 2026: Analysts See 9% Downside
The average price target for Flex LNG is $26.13. This price target represents the analysts' view of the stock price over the next 12 months. The stock appears overvalued, because the price target is lower than the current price. It is -8.80% above the target, and analysts expect the price to fall over the next 12 months. Even if the stock may be overvalued, price momentum can last longer than expected. That is why it is important to keep an eye on the stock and its momentum on an ongoing basis. WallStreetBuys helps you with the technical analysis and keeps you up to date on the development.Is Flex LNG overvalued or undervalued?
Flex LNG is currently fairly valued with a gap of 8.8% relative to the price target.
The current price is $28.65, which places Flex LNG in the fairly valued category. The stock is considered undervalued when the price is below $23.52, and overvalued when the price exceeds $28.74.
The fair value range is defined as ±10% of the price target, because price targets are estimates rather than exact values. For Flex LNG, the fair value range lies between $23.52 and $28.74.
Analyst Ratings for Flex LNG stock in 2026: Sell
5 analysts cover Flex LNG. The majority is negative — 60% recommend selling the stock. The average price target is $26.13, which is 8.8% below the current price.
About Flex LNG – Oil & Gas Midstream
FLEX LNG Ltd., together with its subsidiaries, engages in the seaborne transportation of liquefied natural gas (LNG) worldwide. As of December 31, 2025, its fleet consists of 13 LNG carriers in operation. The company was incorporated in 2006 and is based in Hamilton, Bermuda. Read more about the companyKey Figures for Flex LNG
What kind of stock is Flex LNG?
Flex LNG is classified as a growth stock and quality stock. This means the stock combines several attractive traits, strong financial health (Piotroski 7/9).
Score Overview for Flex LNG
📈 Valuation
Flex LNG trades at a P/E ratio of 15.0, which is close to the market average. The forward P/E is 12.4 (18% lower), which suggests the market expects rising earnings. The P/S ratio is 4.2. The P/B ratio is 2.2.
💵 Profitability & Growth
Flex LNG has a profit margin of 28.5% (excellent) and an operating margin of 55.7%. Return on equity (ROE) is 14.0% — solid return on equity. Return on assets (ROA) is 4.3%. The latest quarterly earnings grew 159.1% year over year — strong growth.
🏦 Financial Health
The Piotroski score is 7 out of 9 — good financial health. Altman Z2 is 1.43 (middle zone — moderate). The debt-to-equity ratio (D/E) is 230.9% — high debt, which raises the risk.
🚀 Momentum & Short Interest
Short interest is 15.28% — very high, the market is skeptical.
Flex LNG Dividend
How much does Flex LNG pay in dividends?
Flex LNG does not currently pay a dividend. This may be because the company reinvests its profits in growth, or because there is not enough profit for dividend payments. You can find more information about the dividend policy on the company's website.
Historical Dividend Payments for Flex LNG
No historical dividend payments are registered for this stock.
| Ex-date | Payment date | Amount | Currency |
|---|---|---|---|
| No historical dividend payments available. | |||
Flex LNG Short Selling 2026: 15.3% Sold Short
What does this mean for you as an investor?
A short interest of 15.3% means that 15.3% of the freely traded shares in Flex LNG have been borrowed and sold by investors betting on falling prices. On positive surprises (e.g. a strong earnings report), short sellers can be forced to buy back shares quickly to close their positions, which can cause a short squeeze with sharp price gains in a short time.
The next potential catalyst is the earnings report on Nov 11, 2026. With a short interest of 15.3%, the report can trigger considerable volatility.
Short interest comes from our data provider EODHD. The figure is reported about twice a month; we check it every trading day.
When Does Flex LNG Report Earnings – Next Date: Nov 11, 2026
The next earnings report from Flex LNG is scheduled for November 11, 2026, before the market opens. This report covers the third quarter (Q3), which ended on September 30, 2026.Technical Analysis of Flex LNG 2026 – Signal: Sell
Based on trend analysis (SMA50/SMA200) and MACD trend (positive/negative on a daily + weekly basis). Updated October 30, 2026.
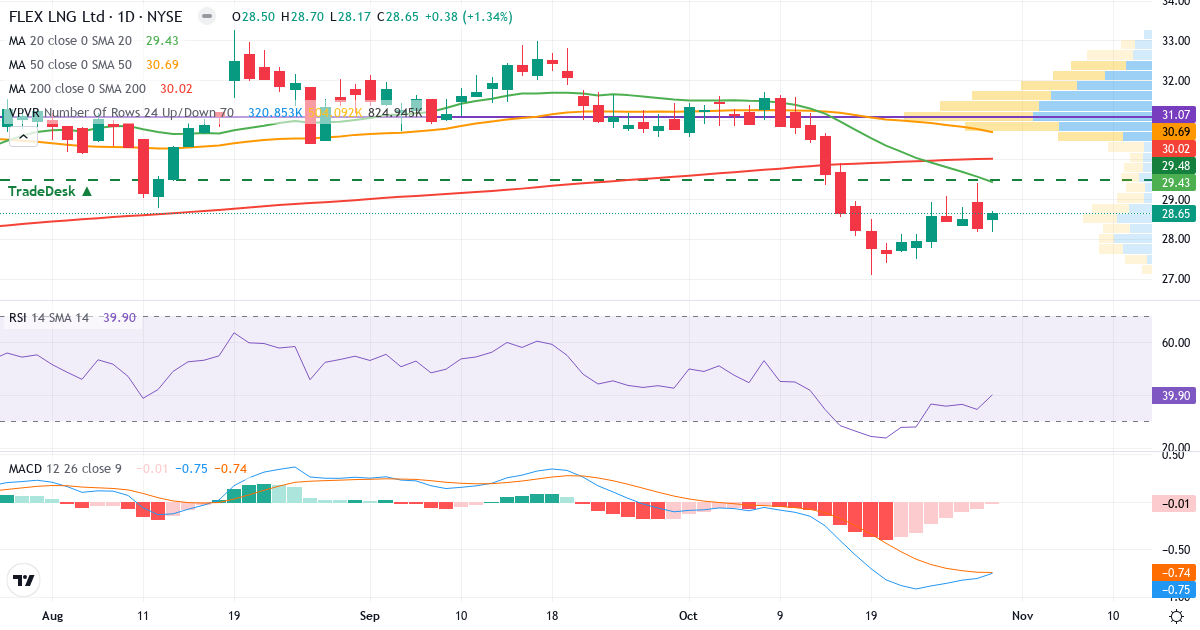
Trend Analysis of Flex LNG Ltd
Flex LNG Ltd is in a short-term downtrend. The price of $28.65 is 2.7% below the 20-day average ($29.43). Medium term, the picture is negative: the price is 6.2% below the 50-day average ($30.54). Long term, the stock is 1.3% below the 200-day average ($29.02), which signals a long-term downtrend.
Golden Cross: The 50-day average (30.54) is above the 200-day average (29.02), which is a classic bullish signal for Flex LNG Ltd.
Is Flex LNG Ltd overbought or oversold?
Flex LNG Ltd has an RSI of 40.3. The stock sits in the lower part of the neutral zone, which points to weak momentum without being oversold. In the current downtrend, be careful about reading this as a buying opportunity.
MACD Analysis for Flex LNG Ltd
Daily MACD: MACD is negative (-0.720), which means the short-term trend is bearish (the 12-day EMA is below the 26-day EMA). MACD is below the signal line (-0.696) by 0.024, which confirms growing negative momentum in the downtrend.
Weekly MACD: MACD5 is positive (0.419), which indicates a broader bullish long-term trend. MACD5 is below the signal line (0.901) by 0.482, which suggests the long-term momentum is fading – the positive trend could come under pressure.
Overall MACD assessment: The daily and weekly MACD give conflicting signals. The long-term trend is bullish, but the short-term trend is bearish. Short-term momentum is still falling – a deeper pullback is possible.
Risk Profile for Flex LNG Ltd
Flex LNG Ltd has an annual standard deviation of 26.9%, which classifies the stock as Balanced. There is some volatility, but the price is relatively stable.
Overall Technical Conclusion for Flex LNG Ltd
Trend: Negative. The price trades below SMA50 and SMA200.
MACD trend (zero line): Daily bearish (-0.720). Weekly bullish (0.419).
MACD momentum (signal): Daily falling. Weekly falling.
RSI: 40.3 – neutral.
Technical signal: Sell
The trend is negative and MACD is below the zero line, which confirms the bearish momentum. Consider reducing the position or setting a stop-loss.
Frequently Asked Questions About Flex LNG stock in 2026
Should you buy Flex LNG stock now?
What is the price target for Flex LNG stock?
Is Flex LNG a dividend stock?
What is the risk of Flex LNG stock?
Is Flex LNG overvalued?
Is Flex LNG overbought?
When is the next Flex LNG earnings report?
Is Flex LNG shorted?
Are insiders buying Flex LNG stock?
Is Flex LNG a good stock?
What is the outlook for Flex LNG stock?
Why is Flex LNG stock falling?
How high can Flex LNG go?
How low can Flex LNG fall?
What does Flex LNG do?
Did Flex LNG raise or lower its guidance?
Is Flex LNG making money or losing money?
Can Flex LNG go bankrupt?
Does Flex LNG have a lot of debt?
Other Stocks in Energy
Compare Flex LNG with other stocks in the energy sector. Click a stock to see its technical analysis, insider trading and key figures.
See all 45 stocks in the Energy sector