Bank of America (BAC.US) Price Target 2026/2027: 25% Upside – Rating and Stock Analysis

54.10
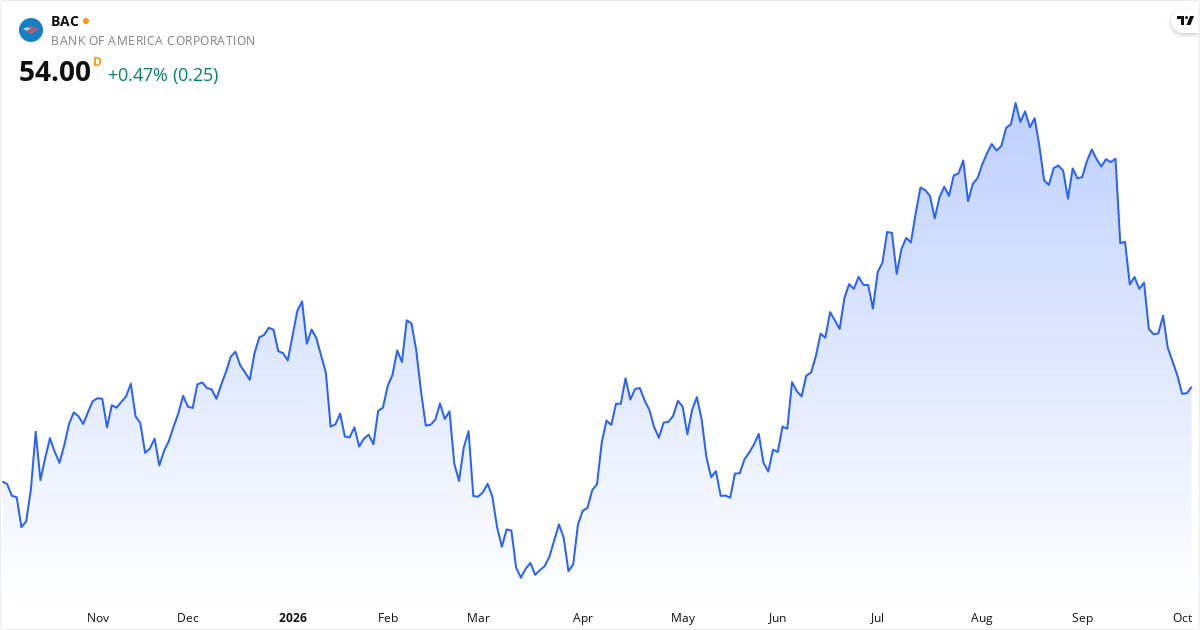
Price history for Bank of America (BAC.US) – stock price at $54.10, October 2026
Bank of America stock price – price development 2026. Updated Oct 7, 2026.
Share this analysis:

Bank of America Price Target 2026: Analysts See 27% Upside

The average price target for Bank of America is $68.62. This price target represents the analysts' view of the stock price over the next 12 months. The stock may be undervalued, because the price target is higher than the current price. The stock is 26.84% below the target, which can point to potential returns within the next 12 months if the analysts' view proves right. Also consider the stock's valuation ratios such as P/E, P/S and P/B, plus the technical analysis further down the page, for the full picture.

Is Bank of America overvalued or undervalued?

Bank of America is currently undervalued with a gap of 26.8% relative to the price target.


The current price is $54.10, which places Bank of America in the undervalued category. The stock is considered undervalued when the price is below $61.76, and overvalued when the price exceeds $75.48.


The fair value range is defined as ±10% of the price target, because price targets are estimates rather than exact values. For Bank of America, the fair value range lies between $61.76 and $75.48.


See the full price target analysis for Bank of America →

Analyst Ratings for Bank of America stock in 2026: Buy

25 analysts cover Bank of America. There is broad agreement on a positive view — 88% recommend buying. The average price target is $68.62, which gives an upside of 26.8% from the current price.

Consensus: Buy (4.48/5)
Strong Buy
15 (60%)
Buy
7 (28%)
Hold
3 (12%)
Strong Sell Sell Hold Buy Strong Buy
4.48 out of 5 based on 25 analysts

About Bank of America – Banks - Diversified

Bank of America Corporation, through its subsidiaries, provides various financial products and services for individual consumers, small and middle-market businesses, institutional investors, large corporations, and governments worldwide. It operates through four segments: Consumer Banking, Global Wealth & Investment Management (GWIM), Global Banking, and Global Markets. The Consumer Banking segment offers traditional and money market savings accounts, certificates of deposit and IRAs, checking accounts, and investment accounts and products; credit and debit cards; residential mortgages and home equity loans; and direct and indirect loans. The GWIM segment provides investment management, brokerage, banking, and trust and retirement products and services; wealth management solutions; and customized solutions, including specialty asset management services. The Global Banking segment offers lending products and services, including commercial loans, leases, commitment facilities, trade finance, and commercial real estate and asset-based lending; treasury solutions, and underwriting and advisory services. The Global Markets segment provides market-making, financing, securities clearing, settlement, and custody services; securities and derivative products; and risk management products using interest rate, equity, credit, currency and commodity derivatives, foreign exchange, fixed-income, and mortgage-related products. Bank of America Corporation was founded in 1784 and is based in Charlotte, North Carolina. Read more about the company

Key Figures for Bank of America

$388B Market cap
$114B Revenue
Banks - Diversified Industry
13.08 P/E
3.40 P/S
1.42 P/B
United States Listed on exchange

What kind of stock is Bank of America?

Growth stock Value stock Quality stock

Bank of America is classified as a growth stock and value stock and quality stock. This means the stock combines several attractive traits, strong financial health (Piotroski 8/9).

Score Overview for Bank of America

💰 Value Score 86/100 (Very High)
⭐ Quality Score 90/100 (Very High)
🚀 Momentum Score 53/100 (Neutral)
📊 Total Score 76/100

⚠️ 1 red flag identified 1 critical

Our analysis has identified 1 potential risk factor in Bank of America that investors should be aware of.

🚨 High debt: The debt-to-equity ratio is 1,004% – the company carries considerably more debt than equity, which raises the financial risk.

📈 Valuation

Bank of America trades at a P/E ratio of 13.1, which is below the market average and can point to an attractive price. The forward P/E is 10.8 (18% lower), which suggests the market expects rising earnings. The P/S ratio is 3.4. The P/B ratio is 1.4. The PEG ratio is 0.85 — below 1.0 suggests the stock is cheap relative to its growth rate.

💵 Profitability & Growth

Bank of America has a profit margin of 29.5% (excellent) and an operating margin of 38.3%. Return on equity (ROE) is 11.2% — solid return on equity. Return on assets (ROA) is 1.0%. The latest quarterly earnings grew 34.1% year over year — strong growth.

🏦 Financial Health

The Piotroski score is 8 out of 9 — excellent financial health. The debt-to-equity ratio (D/E) is 1,003.5% — high debt, which raises the risk.

Bank of America Dividend 2026: 2.0% Dividend Yield

Dividend Key Figures for Bank of America

Dividend yield
1.98%
Latest dividend per share
0.32 USD
Payout ratio
26.6%
Low
Dividend growth (5 years)
+319.0%
Avg. annual dividend (3 years)
0.99 USD

When does Bank of America pay a dividend in 2026?

Latest ex-dividend date (traded without the dividend)
September 4, 2026
Latest payment date
September 25, 2026

How much does Bank of America pay in dividends?

Bank of America pays dividends to its shareholders. The most recently paid dividend was 0.32 USD per share, which corresponds to a dividend yield of 1.98%. Over the last 5 years, the annual dividend has grown by 319.0%, which shows positive dividend growth.

The payout ratio is 26.6%, which is low. This suggests the company prioritizes reinvesting in growth over dividend payments. There is good room to raise the dividend in the future.

Historical Dividend Payments for Bank of America

We have registered dividend payments for Bank of America since Dec 2, 2021. In that period the stock has paid a dividend 20 times, most recently on Sep 4, 2026. This stock qualifies as a stable dividend stock, because it has paid a dividend at least once a year for the last 5 years. That makes it attractive to investors looking for steady, regular dividend payments.

Ex-datePayment dateAmountCurrency
2026-09-042026-09-250.32USD
2026-06-052026-06-260.28USD
2026-03-062026-03-270.28USD
2025-12-052025-12-260.28USD
2025-09-052025-09-260.28USD
2025-06-062025-06-270.26USD
2025-03-072025-03-280.26USD
2024-12-062024-12-270.26USD
2024-09-062024-09-270.26USD
2024-06-072024-06-280.24USD
2024-02-292024-03-290.24USD
2023-11-302023-12-290.24USD
2023-08-312023-09-290.24USD
2023-06-012023-06-300.22USD
2023-03-022023-03-310.22USD
2022-12-012022-12-300.22USD
2022-09-012022-09-300.22USD
2022-06-022022-06-240.21USD
2022-03-032022-03-250.21USD
2021-12-022021-12-310.21USD

Insider Trading in Bank of America 2026: The Signal Is mostly negative

In 2026, insiders at Bank of America have made 20 transactions – split into 3 purchases and 17 sales. On a net basis, insiders took $13,744,740 out of the stock. Active insiders include BANK OF AMERICA CORP /DE/, Greener Geoffrey S, Mensah Bernard A and others. In the short term (last 3 months), the insider signal is mostly negative.

Short-Term Signal (3 months): Mostly negative

Insiders have sold more than they have bought over the last 3 months.

Over the last 3 months: 1 purchases and 7 sales. A net $60,060 out of the stock.

Long-Term Signal (all transactions): Mostly negative

Insiders have sold considerably more than they have bought. At large companies this can be due to planned sales (10b5-1 plans) and is not necessarily a negative signal.

Across the last 20 transactions: 3 purchases and 17 sales. A net $13,744,740 out of the stock.

Latest purchase: BANK OF AMERICA CORP /DE/ bought 437 shares at $6.54 each on 2026-07-17. The stock has since risen 727.1%.

Latest sale: BANK OF AMERICA CORP /DE/ sold 100 shares at $7.36 each on 2026-08-18.

Who is buying: BANK OF AMERICA CORP /DE/.

Who is selling: BANK OF AMERICA CORP /DE/, Greener Geoffrey S, Mensah Bernard A, Scrivener Thomas M.

Latest Insider Trades in Bank of America (2026)

The table shows the last 20 reported insider transactions in Bank of America. Green rows are purchases, red rows are sales. The data is based on official filings.

Transaction date Name Type Number of shares Price per share ($) Total amount ($)
2026-08-18 BANK OF AMERICA CORP /DE/ Sell 100 7 736
2026-08-10 BANK OF AMERICA CORP /DE/ Sell 4,797 12 59,099
2026-08-04 BANK OF AMERICA CORP /DE/ Sell 1 10 10
2026-08-03 BANK OF AMERICA CORP /DE/ Sell 7 10 72
2026-07-31 BANK OF AMERICA CORP /DE/ Sell 5 10 52
2026-07-24 BANK OF AMERICA CORP /DE/ Sell 9 10 92
2026-07-17 BANK OF AMERICA CORP /DE/ Buy 437 7 2,858
2026-07-16 BANK OF AMERICA CORP /DE/ Sell 437 7 2,858
2026-06-11 BANK OF AMERICA CORP /DE/ Sell 1 0 0
2026-05-20 BANK OF AMERICA CORP /DE/ Sell 3,200 10 32,352

Who is buying and selling Bank of America shares in 2026?

The following insiders have bought shares in Bank of America: BANK OF AMERICA CORP /DE/. In total, $18,433 was bought across 3 transactions. The following insiders have sold shares: BANK OF AMERICA CORP /DE/, Greener Geoffrey S, Mensah Bernard A, Scrivener Thomas M. In total, $13,763,173 was sold across 17 transactions. Insider trades are legal transactions in which executives and board members buy or sell shares of their own company. These transactions are reported to the SEC and are publicly available.

When Does Bank of America Report Earnings – Next Date: Oct 14, 2026

The next earnings report from Bank of America is scheduled for October 14, 2026, before the market opens. This report covers the third quarter (Q3), which ended on September 30, 2026.


Technical Analysis of Bank of America 2026 – Signal: Sell

Overall Technical Signal: Sell

Based on trend analysis (SMA50/SMA200) and MACD trend (positive/negative on a daily + weekly basis). Updated October 7, 2026.

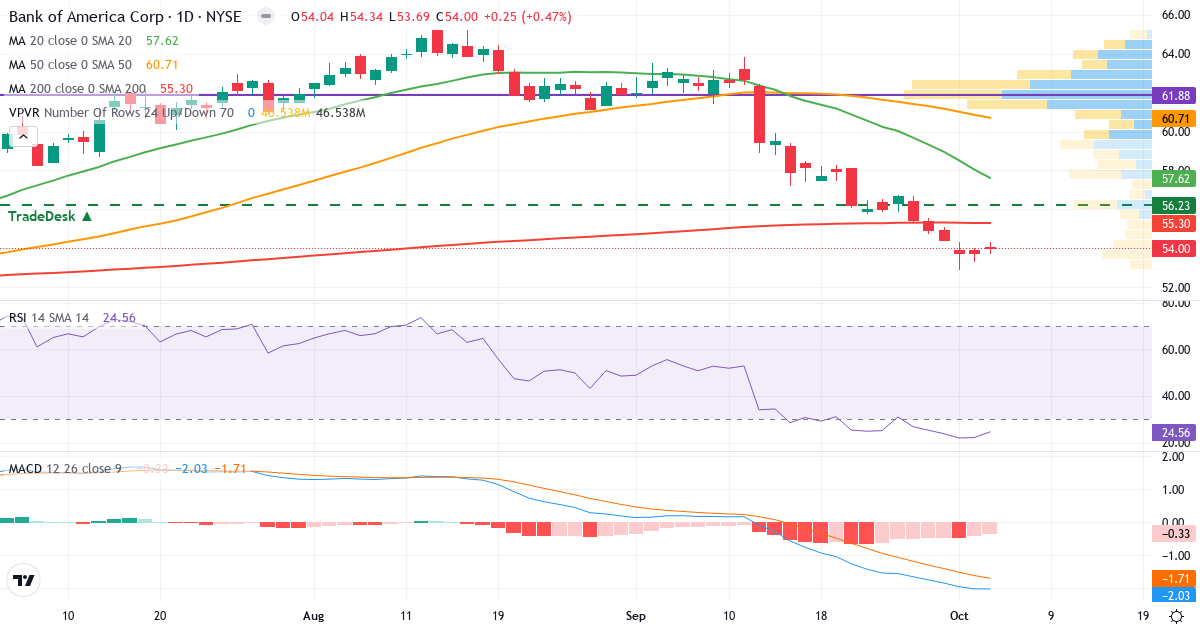
Technical analysis of Bank of America (BAC.US) – RSI 26, MACD negative (bearish), daily candlestick chart October 2026
Bank of America technical analysis – candlestick chart with RSI, MACD and volume profile. Updated Oct 7, 2026.

Trend Analysis of Bank of America Corporation

Bank of America Corporation is in a short-term downtrend. The price of $54.09 is 5.4% below the 20-day average ($57.20). Medium term, the picture is negative: the price is 10.4% below the 50-day average ($60.37). Long term, the stock is 1.3% below the 200-day average ($54.82), which signals a long-term downtrend.

Golden Cross: The 50-day average (60.37) is above the 200-day average (54.82), which is a classic bullish signal for Bank of America Corporation.

Is Bank of America Corporation overbought or oversold?

Bank of America Corporation has an RSI of 25.7, which places the stock in oversold territory (below 30). WARNING: Oversold in a downtrend is NOT a buy signal. When the trend is negative, RSI can stay oversold for a long time while the price keeps falling. Wait for a trend reversal before buying.

MACD Analysis for Bank of America Corporation

Daily MACD: MACD is negative (-1.957), which means the short-term trend is bearish (the 12-day EMA is below the 26-day EMA). MACD is below the signal line (-1.704) by 0.253, which confirms growing negative momentum in the downtrend.

Weekly MACD: MACD5 is positive (1.443), which indicates a broader bullish long-term trend. MACD5 is below the signal line (2.429) by 0.986, which suggests the long-term momentum is fading – the positive trend could come under pressure.

Overall MACD assessment: The daily and weekly MACD give conflicting signals. The long-term trend is bullish, but the short-term trend is bearish. Short-term momentum is still falling – a deeper pullback is possible.

Risk Profile for Bank of America Corporation

Bank of America Corporation has an annual standard deviation of 22.2%, which classifies the stock as Conservative. Price swings are limited, and the stock suits conservative investors.

Overall Technical Conclusion for Bank of America Corporation

Trend: Negative. The price trades below SMA50 and SMA200.

MACD trend (zero line): Daily bearish (-1.957). Weekly bullish (1.443).

MACD momentum (signal): Daily falling. Weekly falling.

RSI: 25.7 – oversold.

Technical signal: Sell

The trend is negative and MACD is below the zero line, which confirms the bearish momentum. Consider reducing the position or setting a stop-loss.

Frequently Asked Questions About Bank of America stock in 2026

Should you buy Bank of America stock now?
No, the technical signal for Bank of America is currently Sell. Bank of America trades at $54.10 as of Oct 7, 2026. The technical analysis shows the following: MACD is negative (bearish trend) at -1.957 with falling momentum (signal: -1.704); RSI is at 25.7 (oversold), which could point to a potential buying opportunity; the stock is in a short-term downtrend (price below the 20-day average); the analyst price target of $68.62 points to 26.8% upside. The stock is in a broader downtrend (below SMA50/SMA200). Buying in a downtrend is generally not recommended. This is a technical observation based on current data, not investment advice.
What is the price target for Bank of America stock?
The average analyst price target for Bank of America is $68.62. The current price is $54.10, which gives an upside of 26.8%. Based on this, the stock is considered undervalued. The fair value range (±10% of the price target) is between $61.76 and $75.48.
Is Bank of America a dividend stock?
Yes, Bank of America is a dividend stock with a dividend yield of 1.98%. The latest dividend was $0.32 per share. The latest ex-dividend date (traded without the dividend) was Sep 4, 2026. The payout ratio is 26.6%, which is considered sustainable.
When does Bank of America pay a dividend in 2026?
The next dividend date for Bank of America has not been set yet. The latest ex-dividend date (last trading day with dividend rights) was Sep 4, 2026. The latest dividend was $0.32 per share with an ex-dividend date of Sep 4, 2026. The dividend yield is 1.98%. The payout ratio of 26.6% points to a sustainable dividend with room to grow.
What is the risk of Bank of America stock?
Bank of America is rated as a stock in the risk category Conservative. the annual standard deviation is 22.2%, which classifies the stock as Conservative. In addition, an RSI of 25.7 signals oversold (potential bottom).
Is Bank of America overvalued?
No, Bank of America is considered undervalued based on the analyst price target (26.8% upside). Bank of America has the following valuation ratios: a P/E ratio of 13.1 (moderately valued), a P/S ratio of 3.4, a P/B ratio of 1.4. The analyst price target suggests that the stock is undervalued by 26.8%.
Is Bank of America overbought?
No, Bank of America is actually oversold with an RSI of 25.7 (below 30). The technical indicators show: RSI is at 25.7 (below the 30 mark), which actually signals the price is oversold – the opposite of overbought. In addition, the price is 5.4% below the 20-day average (short-term downtrend). In addition, MACD is negative with falling momentum (bearish). IMPORTANT: The stock is oversold in a downtrend. A low RSI in a downtrend is NOT a buy signal – the price can keep falling. Wait for a trend reversal before buying.
When is the next Bank of America earnings report?
Bank of America reports its next earnings on October 14, 2026. The stock currently trades at $54.10. With a P/E ratio of 13.1, the market will be watching closely whether earnings meet expectations. The RSI is at 25.7, so the report can reinforce the current technical trend.
Is Bank of America shorted?
There is currently no registered short interest for Bank of America, or the data is not available.
Are insiders buying Bank of America stock?
No, insiders are not buying Bank of America shares – they are net sellers. Over the last 3 months, insiders have made 1 purchases and 7 sales. On a net basis, 60,060 $ worth of shares were sold. Across the last 20 reported transactions, the split is 3 purchases and 17 sales, with a net 13,744,740 $ sold. Active sellers include BANK OF AMERICA CORP /DE/, Greener Geoffrey S, Mensah Bernard A and others. Insider selling can have several explanations (e.g. planned 10b5-1 sales, portfolio diversification or taxes), but sustained selling by several insiders is worth watching closely.
Is Bank of America a good stock?
Based on our total score, Bank of America is rated as a good stock with a total score of 76 out of 100. The stock scores above average on value, quality and momentum. The score is made up of Value: 86/100, Quality: 90/100, Momentum: 53/100. In addition: analysts see 26.8% upside to the price target; a dividend of 1.98%; technical signal: Sell. Whether Bank of America is a good investment depends on your time horizon, risk profile and portfolio. This is a data-driven observation, not investment advice.
What is the outlook for Bank of America stock?
The outlook for Bank of America based on current data: the average analyst price target is $68.62 (+26.8%); the stock is in a downtrend (below SMA50 and SMA200); the next earnings report is due on Oct 14, 2026, which can move the price; the P/E ratio is 13.1 (low – a possible value stock). Keep in mind that stock prices are affected by many factors, including earnings reports, the economy and market sentiment. Past returns are no guarantee of future returns.
Why is Bank of America stock falling?
Bank of America is falling right now. The technical indicators show: the price is 5.4% below the 20-day average; MACD is negative with falling momentum (bearish signal); insiders have mostly been selling the stock recently. For the latest context, see our technical analysis and insider section above.
How high can Bank of America go?
The average analyst price target for Bank of America is $68.62, which corresponds to a potential gain of 26.8% from the current price of $54.10. The stock has traded between $45.65 and $64.90 over the last 52 weeks. Keep in mind that price targets are estimates, not guarantees. Actual price moves depend on earnings, market conditions and unexpected events.
How low can Bank of America fall?
The stock has traded as low as $45.65 over the last 52 weeks — that is 15.6% below the current price of $54.10. The biggest decline (drawdown) in the same period was 29.7% from high to low. Within a year, the price typically swings about ±22.2% (standard deviation — a measure of price swings). A difficult year could therefore mean a further decline of that size. Remember: past price swings are no guarantee for the future — a stock can fall further than the last 52 weeks suggest, especially on profit warnings, sector crises or a market crash. Use stop-loss orders and spread your portfolio to limit losses in single stocks.
What does Bank of America do?
Bank of America Corporation, through its subsidiaries, provides various financial products and services for individual consumers, small and middle-market businesses, institutional investors, large corporations, and governments worldwide. It operates through four segments: Cons... The company belongs to the Financial Services sector, more specifically the Banks - Diversified industry, is headquartered in United States, and is traded on the USA Stocks. See the key figures, earnings history and price development above to evaluate Bank of America as an investment.
Did Bank of America raise or lower its guidance?
Over the last 60 days we have not registered a guidance raise or cut from Bank of America. The company can still adjust its guidance at quarterly reports or between reports — see the earnings history above.
Is Bank of America making money or losing money?
Yes, Bank of America is making money, not losing it. The company has a profit margin (the share of revenue left over as profit) of 29.5% — which is excellent. The operating margin (profit before interest and taxes) is 38.3%. At a P/E ratio of 13.1, you currently pay 13.1 dollars for every dollar of the company's annual earnings. A consistently profitable company is usually more resilient than growth stocks that are not yet making money.
Can Bank of America go bankrupt?
Altman Z2 is not used for banks and financial companies — their balance sheet is built on debt (that is the business model), so the model would wrongly classify a healthy bank as distressed. For Bank of America, look instead at the capital base (e.g. the core capital ratio), loan losses and earnings power.
Does Bank of America have a lot of debt?
Yes, Bank of America has elevated debt relative to equity. The debt-to-equity ratio (D/E — interest-bearing debt to equity) is 1,004%. For the financial services sector, anything above 400% counts as elevated — that raises the financial risk, especially if interest rates rise or earnings fall. Banks take in deposits (debt) as their raw material and lend it out — which naturally gives a high D/E. 200-400% is typical; only above 400% counts as elevated. Note: D/E levels are highly sector-specific — a bank at 300% debt is normal, a tech stock at 300% is extremely leveraged. Always compare with similar companies in the same sector.
Other Stocks in Financial Services

Compare Bank of America with other stocks in the financial services sector. Click a stock to see its technical analysis, insider trading and key figures.

See all 74 stocks in the Financial Services sector