XPeng (XPEV.US) Price Target 2026/2027: 90% Upside – Rating and Stock Analysis
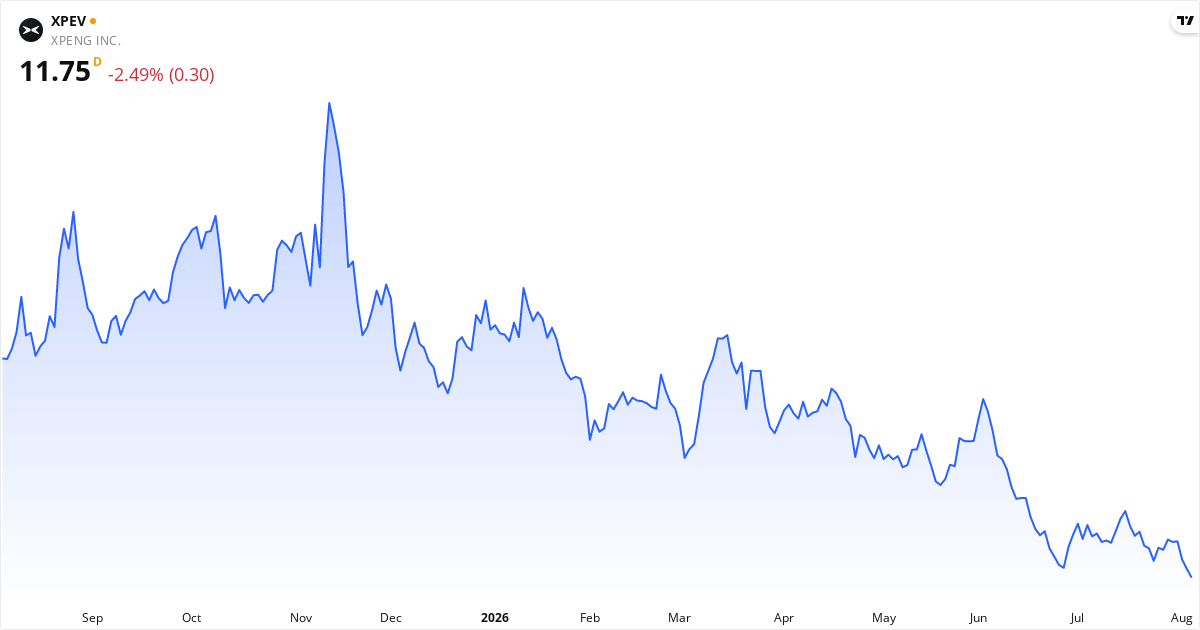
XPeng Price Target 2026: Analysts See 89% Upside
The average price target for XPeng is $22.06. This price target represents the analysts' view of the stock price over the next 12 months. The stock may be undervalued, because the price target is higher than the current price. The stock is 88,63% below the target, which can point to potential returns within the next 12 months if the analysts' view proves right. Also consider the stock's valuation ratios such as P/E, P/S and P/B, plus the technical analysis further down the page, for the full picture.Is XPeng overvalued or undervalued?
XPeng is currently undervalued with a gap of 88.6% relative to the price target.
The current price is $11.70, which places XPeng in the undervalued category. The stock is considered undervalued when the price is below $19.85, and overvalued when the price exceeds $24.27.
The fair value range is defined as ±10% of the price target, because price targets are estimates rather than exact values. For XPeng, the fair value range lies between $19.85 and $24.27.
Analyst Ratings for XPeng stock in 2026: Buy
28 analysts cover XPeng. The majority is positive, with 75% recommending Buy, while 21.4% recommend Hold. The average price target is $22.06, which gives an upside of 88.6% from the current price.
About XPeng – Auto Manufacturers
XPeng Inc. er en kinesisk bilproducent, der blev grundlagt i 2015. De laver og sælger smarte elbiler, og deres hovedkontor ligger i Guangzhou. XPeng er kendt for modeller som SUV’en G9 og sportssedanen P7, som begge bruger ny teknologi til selvkørende funktioner. De tjener primært penge på at sælge biler, men de driver også en række serviceydelser. Det inkluderer superopladning, biludlejning og forsikringsagenturer. XPeng konkurrerer på det hurtigt voksende marked for elektriske køretøjer i Kina. Investorer holder øje med XPeng, fordi de har et bredt udvalg af produkter og er stærkt positioneret i Asien. Read more about the companyKey Figures for XPeng
What kind of stock is XPeng?
XPeng is classified as a speculative stock.
Score Overview for XPeng
📈 Valuation
The P/S ratio is 0.2 (low — potentially undervalued relative to revenue). The P/B ratio is 3.0.
💵 Profitability & Growth
The latest quarterly earnings grew -10.2% year over year — falling earnings.
🏦 Financial Health
The Piotroski score is 3 out of 9 — weak financial health, be careful. Altman Z2 is -0.87 (weak balance sheet — elevated risk). The debt-to-equity ratio (D/E) is 164.4% — moderate debt.
🚀 Momentum & Short Interest
Short interest is 5.94% — elevated, some investors are betting on a decline.
XPeng Short Selling 2026: 5.9% Sold Short
What does this mean for you as an investor?
A short interest of 5.9% means that 5.9% of the freely traded shares in XPeng have been borrowed and sold by investors betting on falling prices.
The next potential catalyst is the earnings report on 8/24/2026. With a short interest of 5.9%, the report can trigger considerable volatility.
Data is updated daily based on official filings with the SEC.
When Does XPeng Report Earnings – Next Date: 8/24/2026
The next earnings report from XPeng is scheduled for August 24, 2026, before the market opens. This report covers the second quarter (Q2), which ended on June 30, 2026.Technical Analysis of XPeng 2026 – Signal: Strong Sell
Based on trend analysis (SMA50/SMA200) and MACD trend (positive/negative on a daily + weekly basis). Updated August 6, 2026.
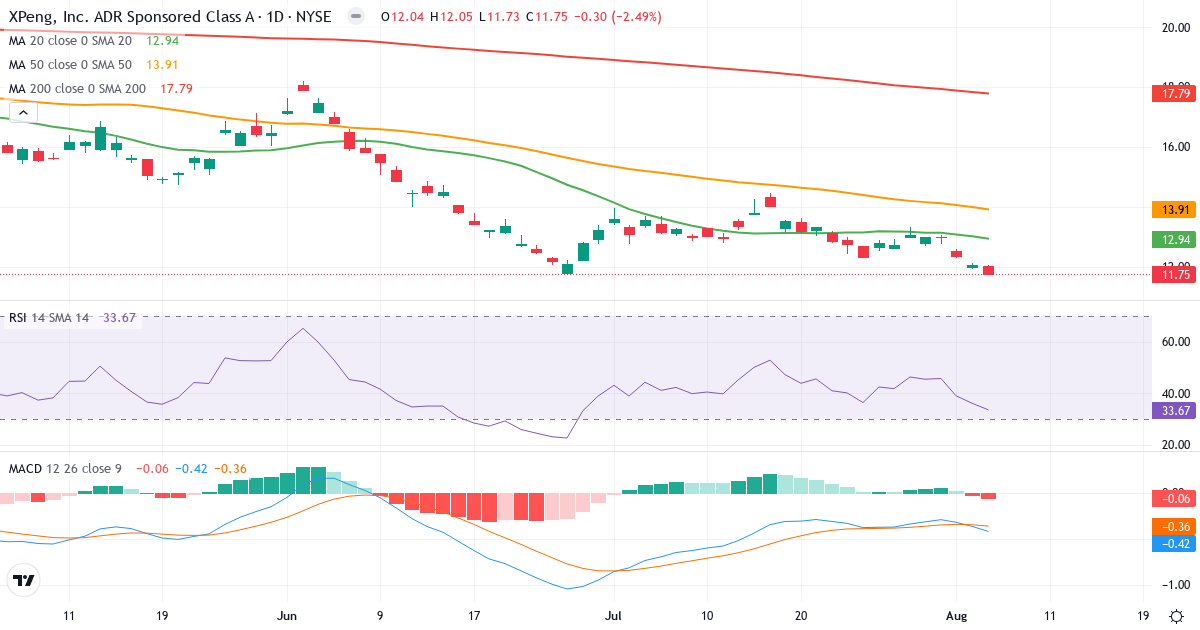
Trend Analysis of XPeng Inc
XPeng Inc is in a short-term downtrend. The price of $11.75 is 9.2% below the 20-day average ($12.94). Medium term, the picture is negative: the price is 15.6% below the 50-day average ($13.91). Long term, the stock is 33.9% below the 200-day average ($17.79), which signals a long-term downtrend.
Death Cross: The 50-day average (13.91) is below the 200-day average (17.79), which is a classic bearish signal for XPeng Inc.
Is XPeng Inc overbought or oversold?
XPeng Inc has an RSI of 33.7. The stock sits in the lower part of the neutral zone, which points to weak momentum without being oversold. In the current downtrend, be careful about reading this as a buying opportunity.
MACD Analysis for XPeng Inc
Daily MACD: MACD is negative (-0.417), which means the short-term trend is bearish (the 12-day EMA is below the 26-day EMA). MACD is below the signal line (-0.360) by 0.057, which confirms growing negative momentum in the downtrend.
Weekly MACD: MACD5 is negative (-1.628), which indicates a broader bearish long-term trend. MACD5 is below the signal line (-1.393) by 0.235, which confirms continued negative long-term momentum.
Overall MACD assessment: Both the daily and weekly MACD are negative and below their signal lines. Trend and momentum are negative across time horizons – the strongest bearish signal.
Risk Profile for XPeng Inc
XPeng Inc has an annual standard deviation of 55.7%, which classifies the stock as high risk. Sizeable price swings are normal, and the stock requires a higher risk tolerance.
Overall Technical Conclusion for XPeng Inc
Trend: Negative. The price trades below SMA50 and SMA200.
MACD trend (zero line): Daily bearish (-0.417). Weekly bearish (-1.628).
MACD momentum (signal): Daily falling. Weekly falling.
RSI: 33.7 – neutral.
Technical signal: Strong Sell
The price is in a downtrend (below SMA50/SMA200) and MACD is negative on both a daily and weekly basis. Avoid buying and consider closing existing positions.