Uranium Royalty (UROY.US) Price Target and Rating 2026/2027
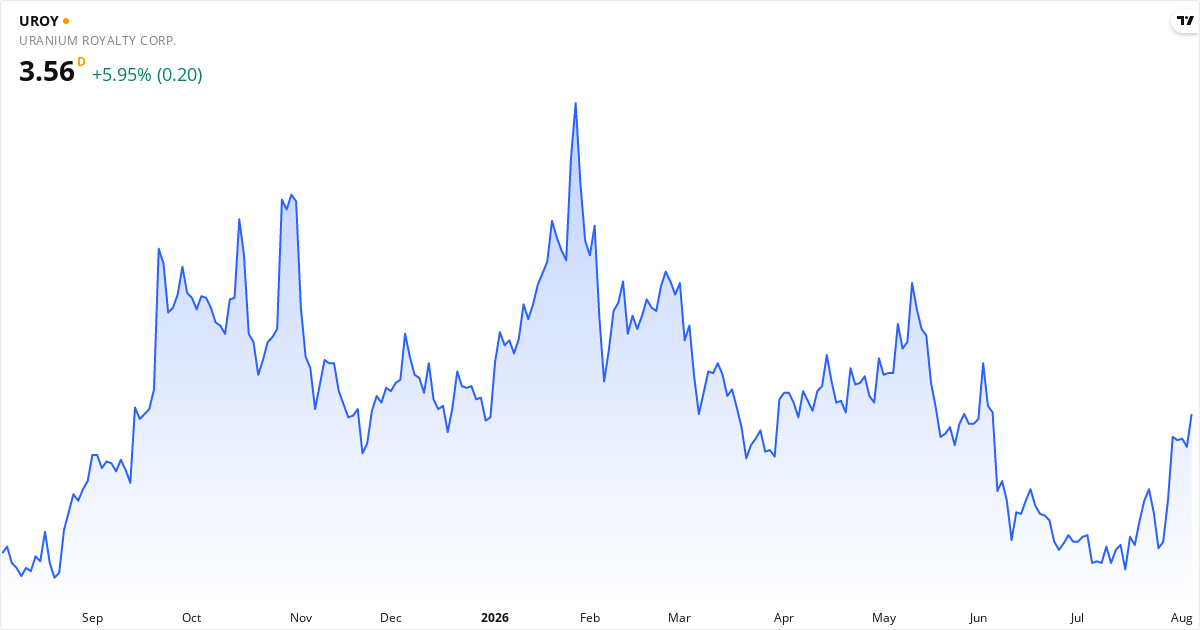
Uranium Royalty Price Target 2026: Analysts See 7% Upside
The average price target for Uranium Royalty is $4.08. This price target represents the analysts' view of the stock price over the next 12 months. The stock may be undervalued, because the price target is higher than the current price. The stock is 7,37% below the target, which can point to potential returns within the next 12 months if the analysts' view proves right. Also consider the stock's valuation ratios such as P/E, P/S and P/B, plus the technical analysis further down the page, for the full picture.Is Uranium Royalty overvalued or undervalued?
Uranium Royalty is currently fairly valued with a gap of 7.4% relative to the price target.
The current price is $3.80, which places Uranium Royalty in the fairly valued category. The stock is considered undervalued when the price is below $3.67, and overvalued when the price exceeds $4.49.
The fair value range is defined as ±10% of the price target, because price targets are estimates rather than exact values. For Uranium Royalty, the fair value range lies between $3.67 and $4.49.
Analyst Ratings for Uranium Royalty stock in 2026: Buy
5 analysts cover Uranium Royalty. There is broad agreement on a positive view — 80% recommend buying. The average price target is $4.08, which gives an upside of 7.4% from the current price.
About Uranium Royalty – Uran
Uranium Royalty Corp. driver forretning som et rendyrket royalty-selskab inden for uran. De tjener primært penge på at samle en portefølje af royalties, hvilket betyder, de får en andel af indtægterne fra uranminer i Canada, USA, Namibia og Spanien. Uranium Royalty Corp. investerer også i selskaber, der arbejder med uran, og handler desuden med fysisk uran. De ejer og styrer altså en bred vifte af uraninteresser geografisk. Virksomheden blev stiftet i 2017 og har hovedkvarter i Vancouver. Deres forretningsmodel sikrer dem eksponering mod uranpriserne uden selv at drive miner. Read more about the companyKey Figures for Uranium Royalty
What kind of stock is Uranium Royalty?
Uranium Royalty is classified as a growth stock with quarterly earnings growth of 462.2% and strong long-term momentum of 0.0%.
Score Overview for Uranium Royalty
📈 Valuation
Uranium Royalty trades at a P/E ratio of 12.0, which is below the market average and can point to an attractive price. The forward P/E is 15.0. The P/S ratio is 6.8 (high — the market pays a premium for the revenue). The P/B ratio is 4.1.
💵 Profitability & Growth
Uranium Royalty has a profit margin of 21.5% (excellent) and an operating margin of 32.1%. Return on equity (ROE) is 15.3% — solid return on equity. Return on assets (ROA) is 10.7%. The latest quarterly earnings grew 462.2% year over year — strong growth.
🏦 Financial Health
The Piotroski score is 6 out of 9 — good financial health. Altman Z2 is 11.69 (healthy balance sheet — low risk). The debt-to-equity ratio (D/E) is 0.4% — low debt, a solid balance sheet.
🚀 Momentum & Short Interest
Short interest is 0.73% — low, the market does not expect a decline.
When Does Uranium Royalty Report Earnings – Next Date: 9/10/2026
The next earnings report from Uranium Royalty is scheduled for September 10, 2026, after the market closes. This report covers the third quarter (Q3), which ended on July 31, 2026.Technical Analysis of Uranium Royalty 2026 – Signal: Buy
Based on trend analysis (SMA50/SMA200) and MACD trend (positive/negative on a daily + weekly basis). Updated August 6, 2026.
Trend Analysis of Uranium Royalty Corp. Common Stock
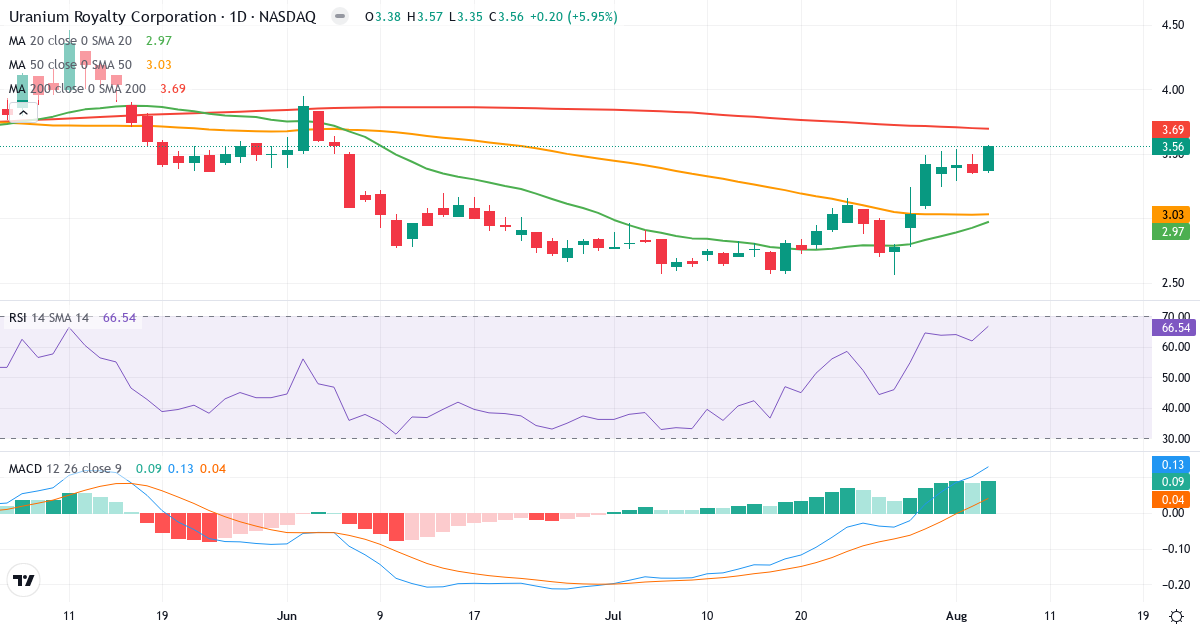
Uranium Royalty Corp. Common Stock is in a short-term uptrend. The price of $3.56 is 19.8% above the 20-day average ($2.97). Medium term, the picture is positive: the price is 17.5% above the 50-day average ($3.03). Long term, the stock is 3.6% below the 200-day average ($3.69), which signals a long-term downtrend.
Death Cross: The 50-day average (3.03) is below the 200-day average (3.69), which is a classic bearish signal for Uranium Royalty Corp. Common Stock.
Is Uranium Royalty Corp. Common Stock overbought or oversold?
Uranium Royalty Corp. Common Stock has an RSI of 66.5. The stock shows positive momentum in the upper part of the neutral zone. Combined with the positive trend, this supports the bullish picture.
MACD Analysis for Uranium Royalty Corp. Common Stock
Daily MACD: MACD is positive (0.127), which means the short-term trend is bullish (the 12-day EMA is above the 26-day EMA). MACD is above the signal line (0.039) by 0.088, which confirms rising momentum in the uptrend.
Weekly MACD: MACD5 is negative (-0.209), which indicates a broader bearish long-term trend. MACD5 is below the signal line (-0.169) by 0.040, which confirms continued negative long-term momentum.
Overall MACD assessment: The daily and weekly MACD give conflicting signals. The short-term trend is bullish, but the long-term trend is still bearish. Wait until the weekly MACD also crosses the zero line before acting.
Risk Profile for Uranium Royalty Corp. Common Stock
Uranium Royalty Corp. Common Stock has an annual standard deviation of 75.2%, which classifies the stock as extreme risk. Only risk-tolerant investors should consider this stock, because the price swings can be very large.
Overall Technical Conclusion for Uranium Royalty Corp. Common Stock
Trend: Positive. The price trades above SMA50 and SMA200.
MACD trend (zero line): Daily bullish (0.127). Weekly bearish (-0.209).
MACD momentum (signal): Daily rising. Weekly falling.
RSI: 66.5 – neutral.
Technical signal: Buy
The broader trend is positive and MACD supports the picture. Consider buying with a stop-loss below the nearest support level.