SK Hynix Inc. (SKHY.US) Price Target 2026/2027: 55% Upside – Rating and Stock Analysis
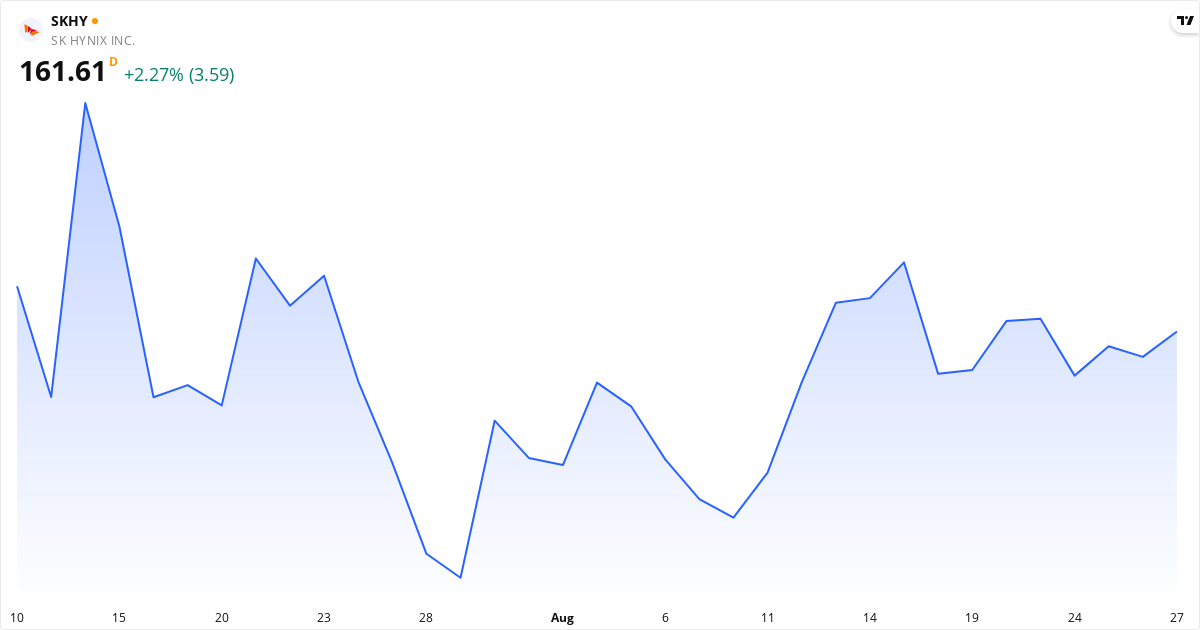
SK Hynix Inc. Price Target 2026: Analysts See 53% Upside
The average price target for SK Hynix Inc. is $246.97. This price target represents the analysts' view of the stock price over the next 12 months. The stock may be undervalued, because the price target is higher than the current price. The stock is 52.82% below the target, which can point to potential returns within the next 12 months if the analysts' view proves right. Also consider the stock's valuation ratios such as P/E, P/S and P/B, plus the technical analysis further down the page, for the full picture.Is SK Hynix Inc. overvalued or undervalued?
SK Hynix Inc. is currently undervalued with a gap of 52.8% relative to the price target.
The current price is $161.61, which places SK Hynix Inc. in the undervalued category. The stock is considered undervalued when the price is below $222.27, and overvalued when the price exceeds $271.67.
The fair value range is defined as ±10% of the price target, because price targets are estimates rather than exact values. For SK Hynix Inc., the fair value range lies between $222.27 and $271.67.
About SK Hynix Inc. – Semiconductors
SK hynix Inc. through its subsidiaries, engages in research, develops, manufactures, distributes, and sells semiconductor devices in Korea, China, rest of Asia, the United States, Europe, and internationally. It offers DRAM, such as server memory, graphics memory, mobile memory, PC memory, consumer memory; NAND flash memory; SSD; and MCP products. It also engages in foundry business, produces non-memory semiconductors. The company serves its products for server, networking, mobile, personal computer, consumer, and automotive applications. The company was formerly known as Hynix Semiconductor Inc. and changed its name to SK hynix Inc. in March 2012. SK hynix Inc. was incorporated in 1949 and is headquartered in Icheon-si, South Korea. Read more about the companyKey Figures for SK Hynix Inc.
What kind of stock is SK Hynix Inc.?
SK Hynix Inc. is classified as a growth stock and value stock and quality stock. This means the stock combines several attractive traits, strong financial health (Piotroski 8/9).
Score Overview for SK Hynix Inc.
📈 Valuation
SK Hynix Inc. trades at a P/E ratio of 9.7, which is below the market average and can point to an attractive price. The forward P/E is 6.0 (38% lower), which suggests the market expects rising earnings. The P/S ratio is 0.0 (low — potentially undervalued relative to revenue). The P/B ratio is 6.0. The PEG ratio is 0.31 — below 1.0 suggests the stock is cheap relative to its growth rate.
💵 Profitability & Growth
SK Hynix Inc. has a profit margin of 85.6% (excellent) and an operating margin of 76.3%. Return on equity (ROE) is 92.7% — excellent return on equity. Return on assets (ROA) is 33.7%. The latest quarterly earnings grew 1,272.4% year over year — strong growth.
🏦 Financial Health
The Piotroski score is 8 out of 9 — excellent financial health. Altman Z2 is 11.03 (healthy balance sheet — low risk). The debt-to-equity ratio (D/E) is 62.2% — low debt, a solid balance sheet.
When Does SK Hynix Inc. Report Earnings?
The next earnings date for SK Hynix Inc. is not yet available. Check the company's investor calendar for more information.Technical Analysis of SK Hynix Inc. 2026 – Signal: Hold
Based on trend analysis (SMA50/SMA200) and MACD trend (positive/negative on a daily + weekly basis). Updated August 28, 2026.
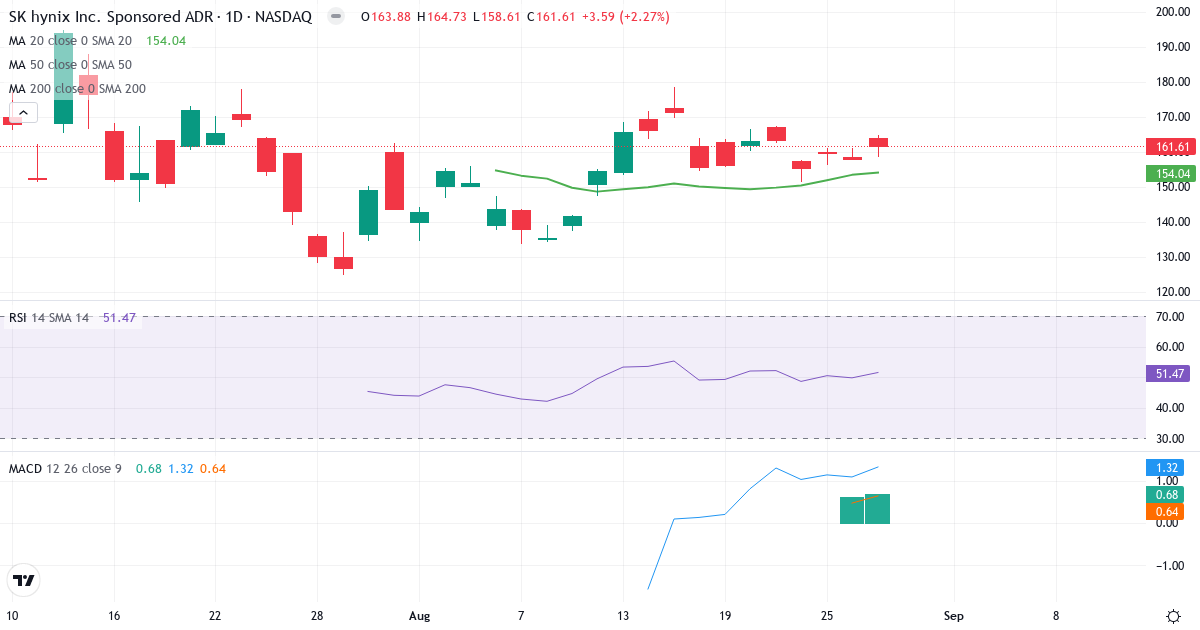
Trend Analysis of SK Hynix Inc. American Depositary Shares
SK Hynix Inc. American Depositary Shares is in a short-term uptrend. The price of $161.61 is 4.9% above the 20-day average ($154.04).
Is SK Hynix Inc. American Depositary Shares overbought or oversold?
SK Hynix Inc. American Depositary Shares has an RSI of 53.7, right in the middle of the neutral zone. There is no clear buying or selling pressure.
MACD Analysis for SK Hynix Inc. American Depositary Shares
Daily MACD: MACD is positive (0.407), which means the short-term trend is bullish (the 12-day EMA is above the 26-day EMA). MACD is above the signal line (-1.521) by 1.928, which confirms rising momentum in the uptrend.
Weekly MACD: MACD5 is negative (0.000), which indicates a broader bearish long-term trend. MACD5 is below the signal line (0.000) by 0.000, which confirms continued negative long-term momentum.
Overall MACD assessment: The daily and weekly MACD give conflicting signals. The short-term trend is bullish, but the long-term trend is still bearish. Wait until the weekly MACD also crosses the zero line before acting.
Risk Profile for SK Hynix Inc. American Depositary Shares
SK Hynix Inc. American Depositary Shares has an annual standard deviation of 130.4%, which classifies the stock as Extremely speculative. Only risk-tolerant investors should consider this stock, because the price swings can be very large.
Overall Technical Conclusion for SK Hynix Inc. American Depositary Shares
Trend: Neutral/mixed.
MACD trend (zero line): Daily bullish (0.407). Weekly bearish (0.000).
MACD momentum (signal): Daily rising. Weekly falling.
RSI: 53.7 – neutral.
Technical signal: Hold
The signals are mixed – trend and MACD point in different directions. Wait until MACD crosses the zero line in the direction of the trend before acting.