SharonAI (SHAZ.US) Price Target 2026/2027: 110% Upside – Rating and Stock Analysis
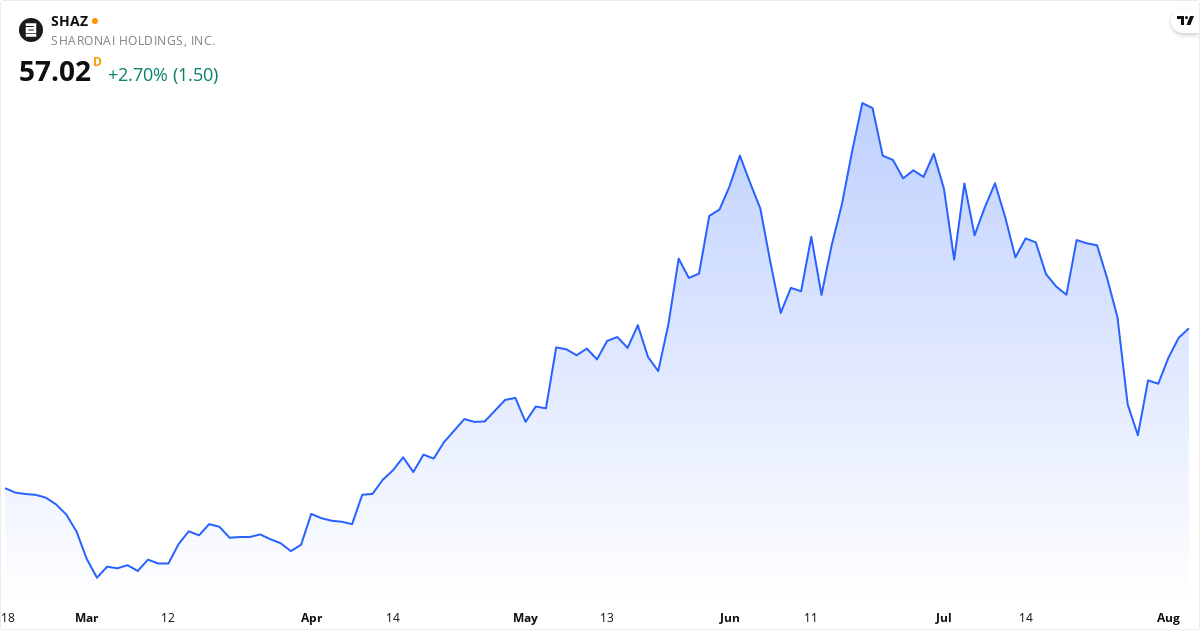
SharonAI Price Target 2026: Analysts See 108% Upside
The average price target for SharonAI is $115.50. This price target represents the analysts' view of the stock price over the next 12 months. The stock may be undervalued, because the price target is higher than the current price. The stock is 107,77% below the target, which can point to potential returns within the next 12 months if the analysts' view proves right. Also consider the stock's valuation ratios such as P/E, P/S and P/B, plus the technical analysis further down the page, for the full picture.Is SharonAI overvalued or undervalued?
SharonAI is currently undervalued with a gap of 107.8% relative to the price target.
The current price is $55.59, which places SharonAI in the undervalued category. The stock is considered undervalued when the price is below $103.95, and overvalued when the price exceeds $127.05.
The fair value range is defined as ±10% of the price target, because price targets are estimates rather than exact values. For SharonAI, the fair value range lies between $103.95 and $127.05.
About SharonAI – IT
SharonAI Holdings Inc. operates as a computing company specializing in accelerated compute platforms, AI infrastructure, and cloud GPU environments. It operates through a hybrid model that combines deployment in data centers with the development of its data center facilities in strategic locations. Its platform integrates compute, storage, networking, and automation into a unified enterprise solution serving AI labs, hyperscale customers, research institutions, and regulated industries. The company was formerly known as Roth CH Holding Inc. SharonAI Holdings Inc. was founded in 2024 and is based in New York, New York. Read more about the companyKey Figures for SharonAI
What kind of stock is SharonAI?
SharonAI is classified as a speculative stock.
Score Overview for SharonAI
📈 Valuation
The P/S ratio is 1,299.5 (high — the market pays a premium for the revenue). The P/B ratio is 19.2.
🏦 Financial Health
The Piotroski score is 2 out of 9 — weak financial health, be careful. Altman Z2 is -1.01 (weak balance sheet — elevated risk). The debt-to-equity ratio (D/E) is 7.5% — low debt, a solid balance sheet.
🚀 Momentum & Short Interest
Short interest is 10.03% — very high, the market is skeptical.
SharonAI Short Selling 2026: 10.0% Sold Short
What does this mean for you as an investor?
A short interest of 10.0% means that 10.0% of the freely traded shares in SharonAI have been borrowed and sold by investors betting on falling prices. On positive surprises (e.g. a strong earnings report), short sellers can be forced to buy back shares quickly to close their positions, which can cause a short squeeze with sharp price gains in a short time.
The next potential catalyst is the earnings report on 8/6/2026. With a short interest of 10.0%, the report can trigger considerable volatility.
Data is updated daily based on official filings with the SEC.
SharonAI Earnings – ⚡ Reporting TODAY 8/6/2026
The next earnings date for SharonAI is not yet available. Check the company's investor calendar for more information.Technical Analysis of SharonAI 2026 – Signal: Hold
Based on trend analysis (SMA50/SMA200) and MACD trend (positive/negative on a daily + weekly basis). Updated August 6, 2026.
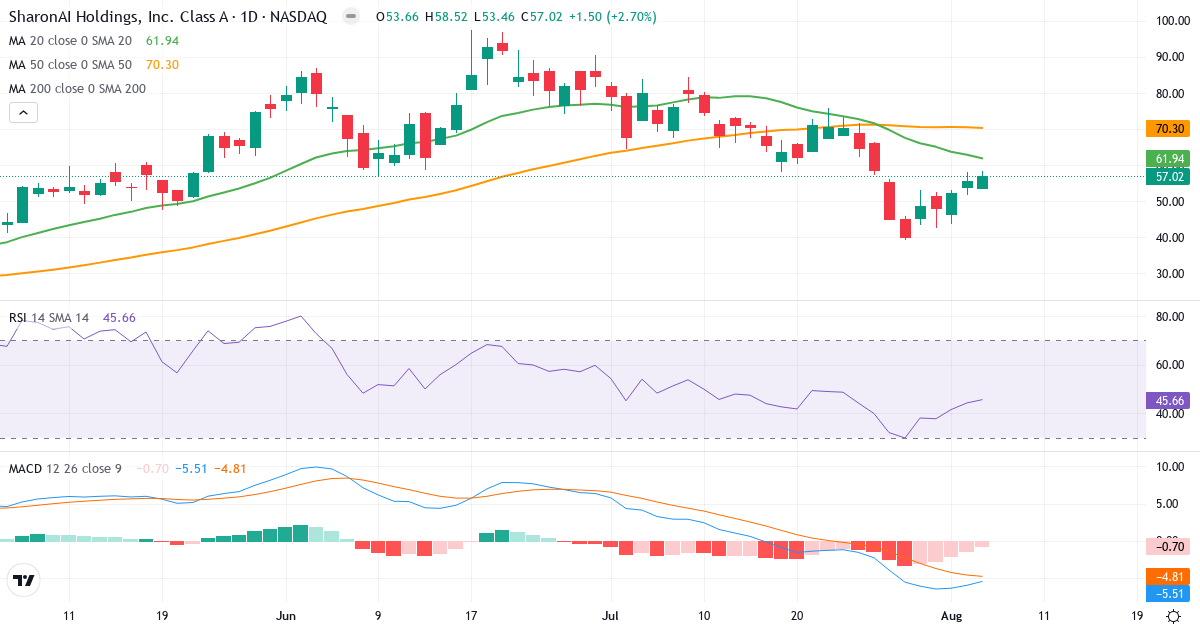
Trend Analysis of SharonAI Holdings, Inc. Class A Common Stock
SharonAI Holdings, Inc. Class A Common Stock is in a short-term downtrend. The price of $57.02 is 7.9% below the 20-day average ($61.94). Medium term, the picture is negative: the price is 18.9% below the 50-day average ($70.30). Long term, the stock is 21.9% above the 200-day average ($46.78), which confirms a long-term uptrend.
Golden Cross: The 50-day average (70.30) is above the 200-day average (46.78), which is a classic bullish signal for SharonAI Holdings, Inc. Class A Common Stock.
Is SharonAI Holdings, Inc. Class A Common Stock overbought or oversold?
SharonAI Holdings, Inc. Class A Common Stock has an RSI of 45.7, right in the middle of the neutral zone. There is no clear buying or selling pressure.
MACD Analysis for SharonAI Holdings, Inc. Class A Common Stock
Daily MACD: MACD is negative (-5.521), which means the short-term trend is bearish (the 12-day EMA is below the 26-day EMA). MACD is below the signal line (-4.825) by 0.696, which confirms growing negative momentum in the downtrend.
Weekly MACD: MACD5 is positive (7.628), which indicates a broader bullish long-term trend. MACD5 is below the signal line (9.620) by 1.992, which suggests the long-term momentum is fading – the positive trend could come under pressure.
Overall MACD assessment: The daily and weekly MACD give conflicting signals. The long-term trend is bullish, but the short-term trend is bearish. Short-term momentum is still falling – a deeper pullback is possible.
Risk Profile for SharonAI Holdings, Inc. Class A Common Stock
SharonAI Holdings, Inc. Class A Common Stock has an annual standard deviation of 1,000.0%, which classifies the stock as extreme risk. Only risk-tolerant investors should consider this stock, because the price swings can be very large.
Overall Technical Conclusion for SharonAI Holdings, Inc. Class A Common Stock
Trend: Neutral/mixed.
MACD trend (zero line): Daily bearish (-5.521). Weekly bullish (7.628).
MACD momentum (signal): Daily falling. Weekly falling.
RSI: 45.7 – neutral.
Technical signal: Hold
The signals are mixed – trend and MACD point in different directions. Wait until MACD crosses the zero line in the direction of the trend before acting.