ICON (ICLR.US) Price Target 2026/2027: 15% Upside – Rating and Stock Analysis
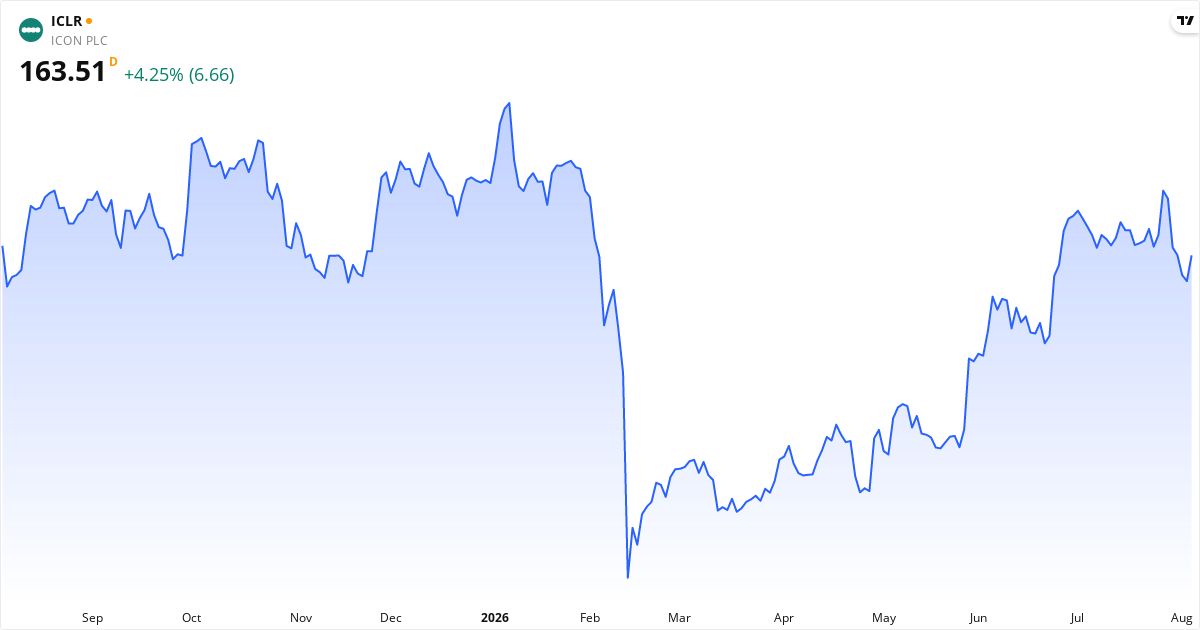
ICON Price Target 2026: Analysts See 15% Upside
The average price target for ICON is $185.56. This price target represents the analysts' view of the stock price over the next 12 months. The stock may be undervalued, because the price target is higher than the current price. The stock is 15,42% below the target, which can point to potential returns within the next 12 months if the analysts' view proves right. Also consider the stock's valuation ratios such as P/E, P/S and P/B, plus the technical analysis further down the page, for the full picture.Is ICON overvalued or undervalued?
ICON is currently undervalued with a gap of 15.4% relative to the price target.
The current price is $160.77, which places ICON in the undervalued category. The stock is considered undervalued when the price is below $167.00, and overvalued when the price exceeds $204.12.
The fair value range is defined as ±10% of the price target, because price targets are estimates rather than exact values. For ICON, the fair value range lies between $167.00 and $204.12.
Analyst Ratings for ICON stock in 2026: Buy
17 analysts cover ICON. The majority is positive, with 64.7% recommending Buy, while 35.3% recommend Hold. The average price target is $185.56, which gives an upside of 15.4% from the current price.
About ICON – Diagnostics & Research
ICON, eller iclr.us, driver en stor, global forretning, hvor de hjælper medicinalfirmaer med at udvikle nye lægemidler. De tjener penge på at levere outsourcing-ydelser til klinisk forskning, fra de første test til det færdige produkt. ICON specialiserer sig i at styre alle faser af de kliniske forsøg, altså Phase I-IV studier. De tilbyder en række services, for eksempel håndtering af data, biostatistik og klinisk operationsstyring. Det er en kompleks proces, og de har laboratorier og specialister i Irland, USA og mange andre lande. Virksomheden blev grundlagt i 1990 og har siden bygget en solid platform for at understøtte den globale lægemiddeludvikling. Read more about the companyKey Figures for ICON
What kind of stock is ICON?
ICON is classified as a speculative stock.
Score Overview for ICON
📈 Valuation
ICON trades at a P/E ratio of 241.3, which is above the market average. The forward P/E is 15.6 (94% lower), which suggests the market expects rising earnings. The P/S ratio is 1.5. The P/B ratio is 1.3. The PEG ratio is 0.53 — below 1.0 suggests the stock is cheap relative to its growth rate.
💵 Profitability & Growth
ICON has a profit margin of 0.3% (moderate) and an operating margin of 9.4%. Return on equity (ROE) is 0.3%. Return on assets (ROA) is 1.0%. The latest quarterly earnings grew -63.3% year over year — falling earnings.
🏦 Financial Health
The Piotroski score is 6 out of 9 — good financial health. Altman Z2 is 2.06 (middle zone — moderate). The debt-to-equity ratio (D/E) is 77.2% — low debt, a solid balance sheet.
🚀 Momentum & Short Interest
Short interest is 3.80%.
ICON Short Selling 2026: 3.8% Sold Short
Data is updated daily based on official filings with the SEC.
When Does ICON Report Earnings?
The next earnings date for ICON is not yet available. Check the company's investor calendar for more information.Technical Analysis of ICON 2026 – Signal: Strong Buy
Based on trend analysis (SMA50/SMA200) and MACD trend (positive/negative on a daily + weekly basis). Updated August 6, 2026.
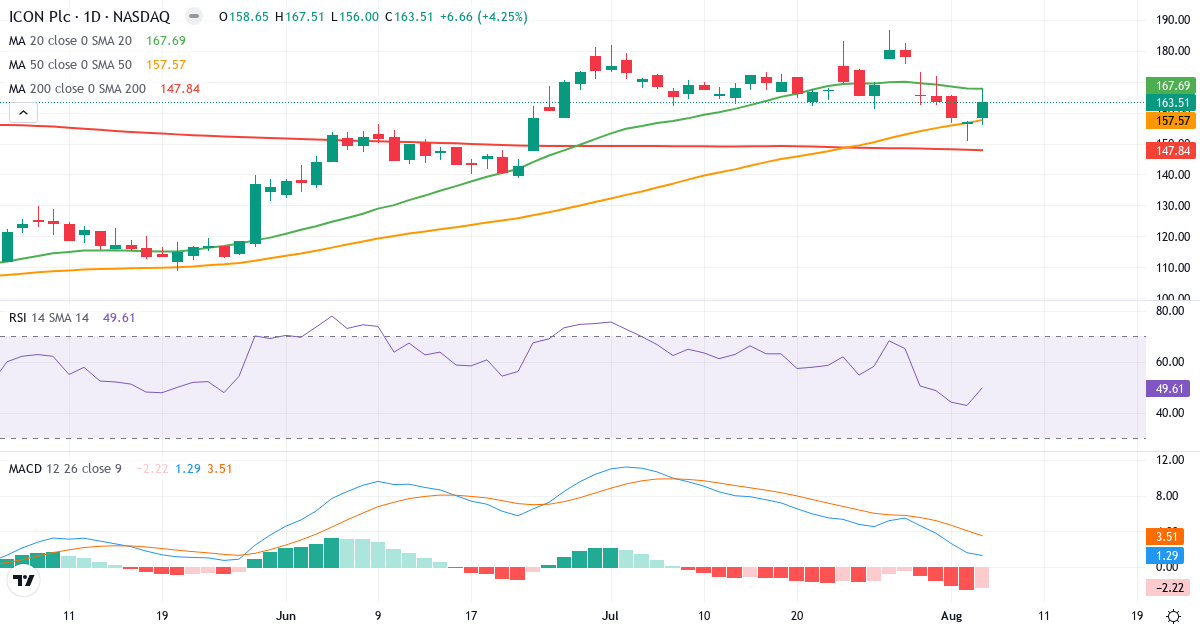
Trend Analysis of ICON PLC
ICON PLC is in a short-term downtrend. The price of $163.51 is 2.5% below the 20-day average ($167.69). Medium term, the picture is positive: the price is 3.8% above the 50-day average ($157.57). Long term, the stock is 10.6% above the 200-day average ($147.84), which confirms a long-term uptrend.
Golden Cross: The 50-day average (157.57) is above the 200-day average (147.84), which is a classic bullish signal for ICON PLC.
Is ICON PLC overbought or oversold?
ICON PLC has an RSI of 49.6, right in the middle of the neutral zone. There is no clear buying or selling pressure.
MACD Analysis for ICON PLC
Daily MACD: MACD is positive (1.293), which means the short-term trend is bullish (the 12-day EMA is above the 26-day EMA). MACD is below the signal line (3.508) by 2.215, which suggests the positive momentum is fading – the trend could be turning.
Weekly MACD: MACD5 is positive (6.765), which indicates a broader bullish long-term trend. MACD5 is above the signal line (0.003) by 6.762, which confirms rising long-term momentum.
Overall MACD assessment: Both the daily and weekly trend are bullish (MACD positive). However, momentum shows signs of weakening on a daily basis. Watch whether the trend holds.
Risk Profile for ICON PLC
ICON PLC has an annual standard deviation of 67.5%, which classifies the stock as high risk. Sizeable price swings are normal, and the stock requires a higher risk tolerance.
Overall Technical Conclusion for ICON PLC
Trend: Positive. The price trades above SMA50 and SMA200.
MACD trend (zero line): Daily bullish (1.293). Weekly bullish (6.765).
MACD momentum (signal): Daily falling. Weekly rising.
RSI: 49.6 – neutral.
Technical signal: Strong Buy
The price is in an uptrend (above SMA50/SMA200) and MACD is positive on both a daily and weekly basis. Trend and MACD trend confirm each other – the strongest technical buy signal.