Hudbay Minerals (HBM.US) Price Target 2026/2027: 25% Upside – Rating and Stock Analysis
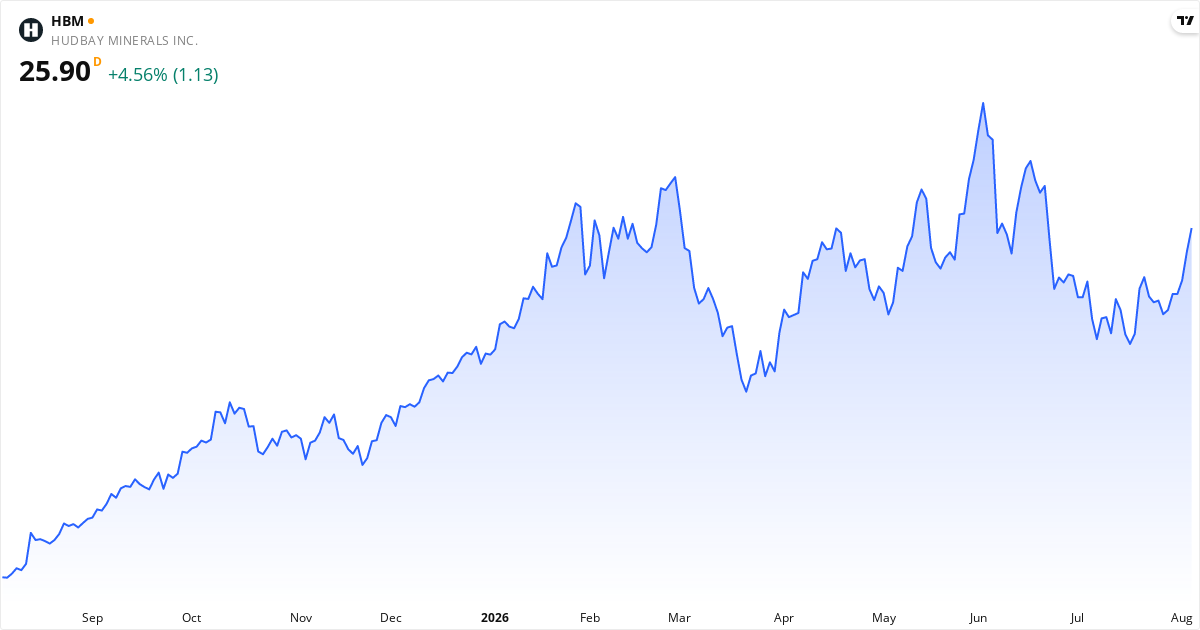
Hudbay Minerals Price Target 2026: Analysts See 24% Upside
The average price target for Hudbay Minerals is $32.60. This price target represents the analysts' view of the stock price over the next 12 months. The stock may be undervalued, because the price target is higher than the current price. The stock is 24,45% below the target, which can point to potential returns within the next 12 months if the analysts' view proves right. Also consider the stock's valuation ratios such as P/E, P/S and P/B, plus the technical analysis further down the page, for the full picture.Is Hudbay Minerals overvalued or undervalued?
Hudbay Minerals is currently undervalued with a gap of 24.5% relative to the price target.
The current price is $26.20, which places Hudbay Minerals in the undervalued category. The stock is considered undervalued when the price is below $29.34, and overvalued when the price exceeds $35.86.
The fair value range is defined as ±10% of the price target, because price targets are estimates rather than exact values. For Hudbay Minerals, the fair value range lies between $29.34 and $35.86.
Analyst Ratings for Hudbay Minerals stock in 2026: Strong Buy
19 analysts cover Hudbay Minerals. There is broad agreement on a positive view — 100% recommend buying. The average price target is $32.60, which gives an upside of 24.5% from the current price.
About Hudbay Minerals – Kobber
Hudbay Minerals laver minedrift og driver projekter i både Nord- og Sydamerika. De tjener primært penge på at udvinde og sælge koncentrater af kobber, som ofte indeholder guld, sølv og molybdæn. Hudbay producerer også zinkkoncentrater og guld/sølv doré. Deres helt store projekt er Constancia-minen i det sydlige Peru, som de ejer 100%. Virksomheden blev grundlagt helt tilbage i 1927 og har hovedsæde i Toronto, Canada. Hudbay Minerals fokuserer på at optimere driften af deres eksisterende miner. Read more about the companyKey Figures for Hudbay Minerals
What kind of stock is Hudbay Minerals?
Hudbay Minerals is classified as a value stock and quality stock. This means the stock combines several attractive traits, strong financial health (Piotroski 7/9).
Score Overview for Hudbay Minerals
📈 Valuation
Hudbay Minerals trades at a P/E ratio of 15.2, which is close to the market average. The forward P/E is 14.9 (2% lower), which suggests the market expects rising earnings. The P/S ratio is 4.7. The P/B ratio is 2.1. The PEG ratio is 2.09 — above 2.0 suggests the stock is expensive relative to its growth rate.
💵 Profitability & Growth
Hudbay Minerals has a profit margin of 27.5% (excellent) and an operating margin of 32.6%. Return on equity (ROE) is 16.7% — solid return on equity. Return on assets (ROA) is 6.7%. The latest quarterly earnings grew 14.1% year over year.
🏦 Financial Health
The Piotroski score is 7 out of 9 — good financial health. Altman Z2 is 3.75 (healthy balance sheet — low risk). The debt-to-equity ratio (D/E) is 111.2% — moderate debt.
🚀 Momentum & Short Interest
Short interest is 1.51% — low, the market does not expect a decline.
Hudbay Minerals Dividend 2026: 0.1% Dividend Yield
Dividend Key Figures for Hudbay Minerals in 2026
When does Hudbay Minerals pay a dividend in 2026?
How much does Hudbay Minerals pay in dividends?
Hudbay Minerals pays dividends to its shareholders. The most recently paid dividend was 0.01 USD per share, which corresponds to a dividend yield of 0.08%. Over the last 5 years, the annual dividend has fallen by 50.0%.
The payout ratio is 2.3%, which is low. This suggests the company prioritizes reinvesting in growth over dividend payments. There is good room to raise the dividend in the future.
Historical Dividend Payments for Hudbay Minerals
We have registered dividend payments for Hudbay Minerals since 2020-03-09. In that period the stock has paid a dividend 48 times, most recently on 2026-06-09. This stock qualifies as a stable dividend stock, because it has paid a dividend at least once a year for the last 5 years. That makes it attractive to investors looking for steady, regular dividend payments.
| Ex-date | Payment date | Amount | Currency | Period |
|---|---|---|---|---|
| 2026-06-09 | 2026-06-26 | 0.01 | USD | Unknown period |
| 2026-06-09 | 2026-06-26 | 0.01 | USD | Unknown period |
| 2026-06-09 | 2026-06-26 | 0.01 | USD | Unknown period |
| 2026-06-09 | 2026-06-26 | 0.01 | USD | Unknown period |
| 2026-06-09 | 2026-06-26 | 0.01 | USD | Unknown period |
| 2026-06-09 | 2026-06-26 | 0.01 | USD | Unknown period |
| 2026-06-09 | 2026-06-26 | 0.01 | USD | Unknown period |
| 2026-06-09 | 2026-06-26 | 0.01 | USD | Unknown period |
| 2026-06-09 | 2026-06-26 | 0.01 | USD | Unknown period |
| 2026-06-09 | 2026-06-26 | 0.01 | USD | Unknown period |
| 2026-06-09 | 2026-06-26 | 0.01 | USD | Unknown period |
| 2026-06-09 | 2026-06-26 | 0.01 | USD | Unknown period |
| 2026-06-09 | 2026-06-26 | 0.01 | USD | Unknown period |
| 2026-06-09 | 2026-06-26 | 0.01 | USD | Unknown period |
| 2026-06-09 | 2026-06-26 | 0.01 | USD | Unknown period |
| 2026-06-09 | 2026-06-26 | 0.01 | USD | Unknown period |
| 2026-06-09 | 2026-06-26 | 0.01 | USD | Unknown period |
| 2026-06-09 | 2026-06-26 | 0.01 | USD | Unknown period |
| 2026-06-09 | 2026-06-26 | 0.01 | USD | Unknown period |
| 2026-06-09 | 2026-06-26 | 0.01 | USD | Unknown period |
| 2026-06-09 | 2026-06-26 | 0.01 | USD | Unknown period |
| 2026-06-09 | 2026-06-26 | 0.01 | USD | Unknown period |
| 2026-06-09 | 2026-06-26 | 0.01 | USD | Unknown period |
| 2026-06-09 | 2026-06-26 | 0.01 | USD | Unknown period |
| 2026-06-09 | 2026-06-26 | 0.01 | USD | Unknown period |
| 2026-06-09 | 2026-06-26 | 0.01 | USD | Unknown period |
| 2026-06-09 | 2026-06-26 | 0.01 | USD | Unknown period |
| 2026-06-09 | 2026-06-26 | 0.01 | USD | Unknown period |
| 2026-06-09 | 2026-06-26 | 0.01 | USD | Unknown period |
| 2026-06-09 | 2026-06-26 | 0.01 | USD | Unknown period |
| 2026-06-09 | 2026-06-26 | 0.01 | USD | Unknown period |
| 2026-06-09 | 2026-06-26 | 0.01 | USD | Unknown period |
| 2026-06-09 | 2026-06-26 | 0.01 | USD | Unknown period |
| 2026-06-09 | 2026-06-26 | 0.01 | USD | Unknown period |
| 2026-06-09 | 2026-06-26 | 0.01 | USD | Unknown period |
| 2026-06-09 | 2026-06-26 | 0.01 | USD | Unknown period |
| 2026-03-10 | 2026-03-27 | 0.01 | USD | Unknown period |
| 2025-09-02 | 2025-09-19 | 0.01 | USD | Unknown period |
| 2024-09-03 | 2024-09-20 | 0.01 | USD | Unknown period |
| 2024-03-04 | 2024-03-22 | 0.01 | USD | Unknown period |
| 2023-08-31 | 2023-09-22 | 0.01 | USD | Unknown period |
| 2023-03-06 | 2023-03-24 | 0.01 | USD | Unknown period |
| 2022-09-01 | 2022-09-23 | 0.01 | USD | Unknown period |
| 2022-03-07 | 2022-03-25 | 0.01 | USD | Unknown period |
| 2021-09-02 | 2021-09-24 | 0.01 | USD | Unknown period |
| 2021-03-08 | 2021-03-26 | 0.01 | USD | Unknown period |
| 2020-09-03 | 2020-09-25 | 0.01 | USD | Unknown period |
| 2020-03-09 | 2020-03-27 | 0.01 | USD | Unknown period |
Hudbay Minerals Short Selling 2026: 1.5% Sold Short
Data is updated daily based on official filings with the SEC.
When Does Hudbay Minerals Report Earnings?
The next earnings date for Hudbay Minerals is not yet available. Check the company's investor calendar for more information.Technical Analysis of Hudbay Minerals 2026 – Signal: Strong Buy
Based on trend analysis (SMA50/SMA200) and MACD trend (positive/negative on a daily + weekly basis). Updated August 6, 2026.
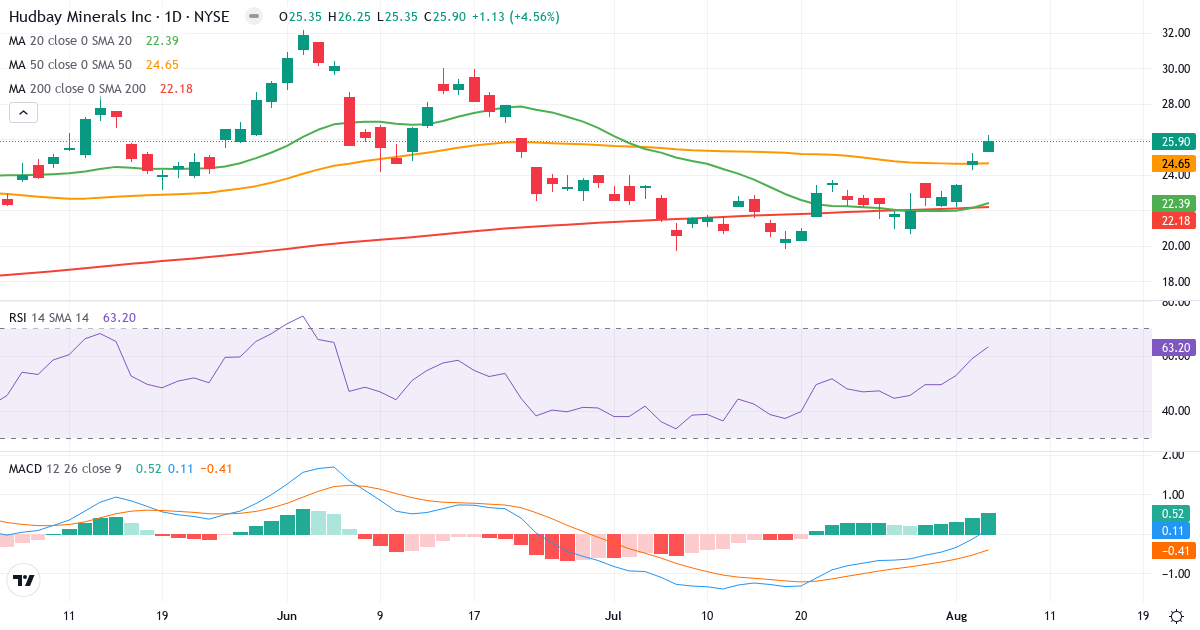
Trend Analysis of Hudbay Minerals Inc
Hudbay Minerals Inc is in a short-term uptrend. The price of $25.90 is 15.7% above the 20-day average ($22.39). Medium term, the picture is positive: the price is 5.1% above the 50-day average ($24.65). Long term, the stock is 16.8% above the 200-day average ($22.18), which confirms a long-term uptrend.
Golden Cross: The 50-day average (24.65) is above the 200-day average (22.18), which is a classic bullish signal for Hudbay Minerals Inc.
Is Hudbay Minerals Inc overbought or oversold?
Hudbay Minerals Inc has an RSI of 63.2. The stock shows positive momentum in the upper part of the neutral zone. Combined with the positive trend, this supports the bullish picture.
MACD Analysis for Hudbay Minerals Inc
Daily MACD: MACD is positive (0.113), which means the short-term trend is bullish (the 12-day EMA is above the 26-day EMA). MACD is above the signal line (-0.411) by 0.524, which confirms rising momentum in the uptrend.
Weekly MACD: MACD5 is positive (0.666), which indicates a broader bullish long-term trend. MACD5 is below the signal line (1.362) by 0.696, which suggests the long-term momentum is fading – the positive trend could come under pressure.
Overall MACD assessment: Both the daily and weekly trend are bullish (MACD positive). However, momentum shows signs of weakening on a weekly basis. Watch whether the trend holds.
Risk Profile for Hudbay Minerals Inc
Hudbay Minerals Inc has an annual standard deviation of 62.9%, which classifies the stock as high risk. Sizeable price swings are normal, and the stock requires a higher risk tolerance.
Overall Technical Conclusion for Hudbay Minerals Inc
Trend: Positive. The price trades above SMA50 and SMA200.
MACD trend (zero line): Daily bullish (0.113). Weekly bullish (0.666).
MACD momentum (signal): Daily rising. Weekly falling.
RSI: 63.2 – neutral.
Technical signal: Strong Buy
The price is in an uptrend (above SMA50/SMA200) and MACD is positive on both a daily and weekly basis. Trend and MACD trend confirm each other – the strongest technical buy signal.