Galmed Pharmaceuticals (GLMD.US) Price Target 2026/2027: 1970% Upside – Rating and Stock Analysis
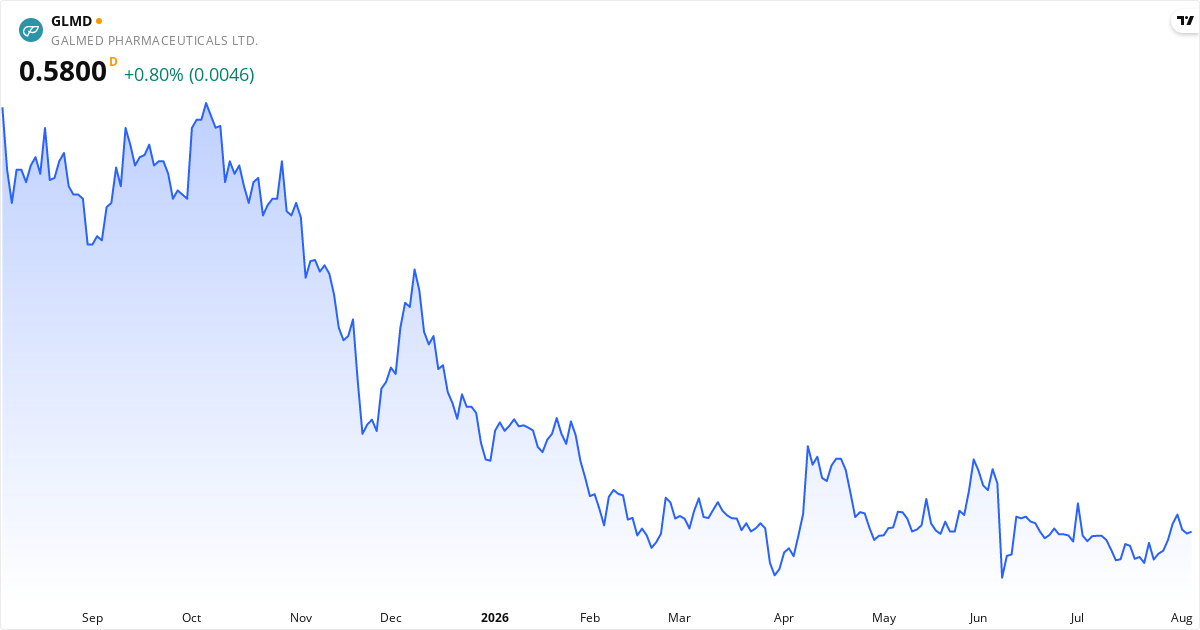
Galmed Pharmaceuticals Price Target 2026: Analysts See 1,969% Upside
The average price target for Galmed Pharmaceuticals is $12.00. This price target represents the analysts' view of the stock price over the next 12 months. The stock may be undervalued, because the price target is higher than the current price. The stock is 1.968,97% below the target, which can point to potential returns within the next 12 months if the analysts' view proves right. Also consider the stock's valuation ratios such as P/E, P/S and P/B, plus the technical analysis further down the page, for the full picture.Is Galmed Pharmaceuticals overvalued or undervalued?
Galmed Pharmaceuticals is currently undervalued with a gap of 1969% relative to the price target.
The current price is $0.58, which places Galmed Pharmaceuticals in the undervalued category. The stock is considered undervalued when the price is below $10.80, and overvalued when the price exceeds $13.20.
The fair value range is defined as ±10% of the price target, because price targets are estimates rather than exact values. For Galmed Pharmaceuticals, the fair value range lies between $10.80 and $13.20.
See the full price target analysis for Galmed Pharmaceuticals →
Analyst Ratings for Galmed Pharmaceuticals stock in 2026: Hold
1 analysts cover Galmed Pharmaceuticals. Analysts are mostly neutral — 100% recommend Hold. The average price target is $12.00, which gives an upside of 1969% from the current price.
About Galmed Pharmaceuticals – Bioteknologi
Galmed Pharmaceuticals (glmd.us) er et biofarmaceutisk selskab, der fokuserer på at udvikle medicin mod leversygdomme. De driver primært forskning i kliniske faser. Deres hovedprodukt er Aramchol, som de tester i et fase III-studie til behandling af NASH (fedtlever), især hos overvægtige patienter med type II-diabetes. Virksomheden tester også Aramchol i et fase IIa-forsøg, der ser på HIV-relateret fedtlever. Galmed Pharmaceuticals arbejder desuden med at udvikle Amilo-5MER, et syntetisk peptid. De har et samarbejde med Gannex Pharma om at udvikle en kombinationsbehandling mod NASH, som kombinerer ASC41 og Aramchol. Virksomheden investerer altså i flere spor for at tackle alvorlige leversygdomme. Read more about the companyKey Figures for Galmed Pharmaceuticals
What kind of stock is Galmed Pharmaceuticals?
Galmed Pharmaceuticals is classified as a speculative stock.
Score Overview for Galmed Pharmaceuticals
📈 Valuation
The P/S ratio is 61.4 (high — the market pays a premium for the revenue). The P/B ratio is 0.4, below book value, which can point to a value opportunity.
🏦 Financial Health
The Piotroski score is 2 out of 9 — weak financial health, be careful. Altman Z2 is -33.74 (weak balance sheet — elevated risk). The debt-to-equity ratio (D/E) is 13.3% — low debt, a solid balance sheet.
🚀 Momentum & Short Interest
Short interest is 0.40% — low, the market does not expect a decline.
When Does Galmed Pharmaceuticals Report Earnings – Next Date: 8/27/2026
The next earnings report from Galmed Pharmaceuticals is scheduled for August 27, 2026. This report covers the second quarter (Q2), which ended on June 30, 2026.Technical Analysis of Galmed Pharmaceuticals 2026 – Signal: Sell
Based on trend analysis (SMA50/SMA200) and MACD trend (positive/negative on a daily + weekly basis). Updated August 6, 2026.
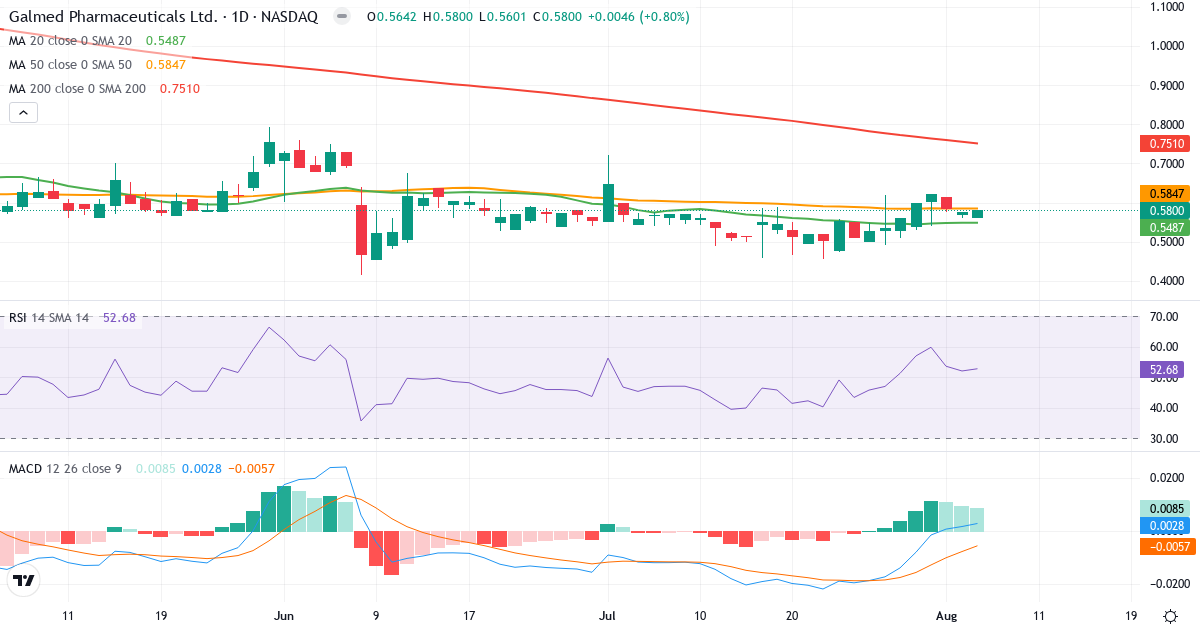
Trend Analysis of Galmed Pharmaceuticals Ltd
Galmed Pharmaceuticals Ltd is in a short-term uptrend. The price of $0.58 is 5.6% above the 20-day average ($0.55). Medium term, the picture is negative: the price is 0.9% below the 50-day average ($0.59). Long term, the stock is 22.8% below the 200-day average ($0.75), which signals a long-term downtrend.
Death Cross: The 50-day average (0.59) is below the 200-day average (0.75), which is a classic bearish signal for Galmed Pharmaceuticals Ltd.
Is Galmed Pharmaceuticals Ltd overbought or oversold?
Galmed Pharmaceuticals Ltd has an RSI of 52.7, right in the middle of the neutral zone. There is no clear buying or selling pressure.
MACD Analysis for Galmed Pharmaceuticals Ltd
Daily MACD: MACD is positive (0.003), which means the short-term trend is bullish (the 12-day EMA is above the 26-day EMA). MACD is above the signal line (-0.006) by 0.009, which confirms rising momentum in the uptrend.
Weekly MACD: MACD5 is negative (-0.094), which indicates a broader bearish long-term trend. MACD5 is above the signal line (-0.117) by 0.023, which suggests the negative long-term momentum is fading – a bigger trend reversal could be ahead.
Overall MACD assessment: The daily and weekly MACD give conflicting signals. The short-term trend is bullish, but the long-term trend is still bearish. Weekly momentum is rising, though, which could signal an upcoming trend reversal.
Risk Profile for Galmed Pharmaceuticals Ltd
Galmed Pharmaceuticals Ltd has an annual standard deviation of 91.5%, which classifies the stock as extreme risk. Only risk-tolerant investors should consider this stock, because the price swings can be very large.
Overall Technical Conclusion for Galmed Pharmaceuticals Ltd
Trend: Negative. The price trades below SMA50 and SMA200.
MACD trend (zero line): Daily bullish (0.003). Weekly bearish (-0.094).
MACD momentum (signal): Daily rising. Weekly rising.
RSI: 52.7 – neutral.
Technical signal: Sell
The trend is negative and MACD is below the zero line, which confirms the bearish momentum. Consider reducing the position or setting a stop-loss.