Fair Isaac (FICO.US) Price Target 2026/2027: 45% Upside – Rating and Stock Analysis

1.034,85
-5,19%
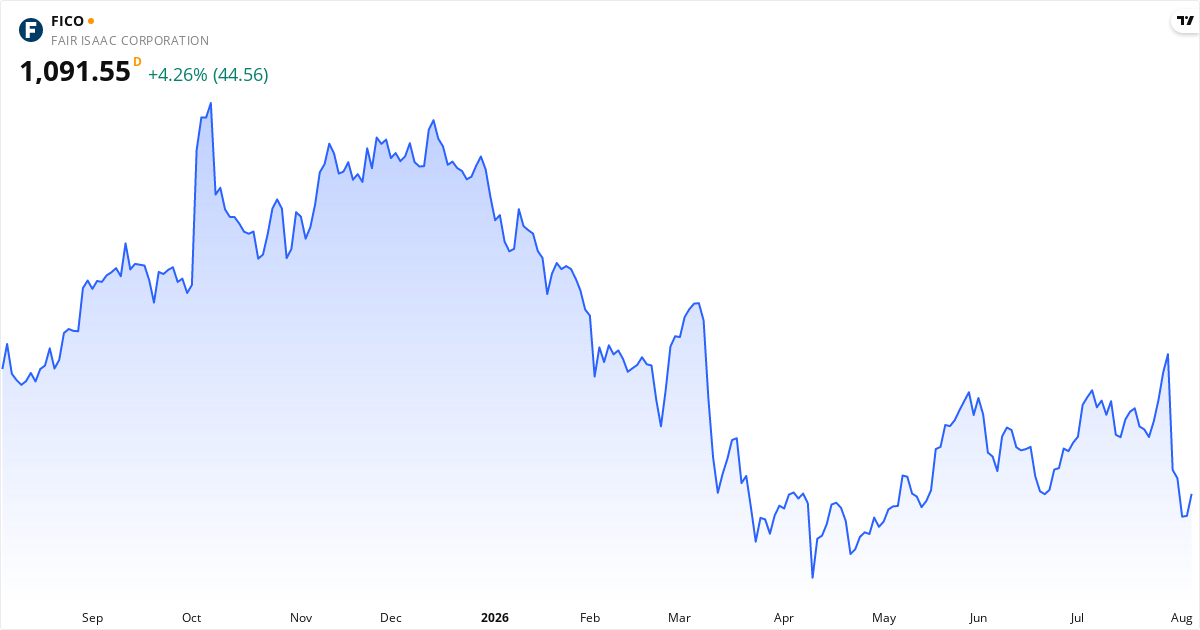
Price history for Fair Isaac (FICO.US) – stock price at 1,034.85 $, August 2026
Fair Isaac stock price – price development 2026. Updated Aug 6, 2026.
Share this analysis:

Fair Isaac Price Target 2026: Analysts See 44% Upside

The average price target for Fair Isaac is $1,489.48. This price target represents the analysts' view of the stock price over the next 12 months. The stock may be undervalued, because the price target is higher than the current price. The stock is 43,93% below the target, which can point to potential returns within the next 12 months if the analysts' view proves right. Also consider the stock's valuation ratios such as P/E, P/S and P/B, plus the technical analysis further down the page, for the full picture.

Is Fair Isaac overvalued or undervalued?

Fair Isaac is currently undervalued with a gap of 43.9% relative to the price target.


The current price is $1,034.85, which places Fair Isaac in the undervalued category. The stock is considered undervalued when the price is below $1,340.53, and overvalued when the price exceeds $1,638.43.


The fair value range is defined as ±10% of the price target, because price targets are estimates rather than exact values. For Fair Isaac, the fair value range lies between $1,340.53 and $1,638.43.


See the full price target analysis for Fair Isaac →

Analyst Ratings for Fair Isaac stock in 2026: Buy

19 analysts cover Fair Isaac. The majority is positive, with 63.1% recommending Buy, while 26.3% recommend Hold. The average price target is $1,489.48, which gives an upside of 43.9% from the current price.

Consensus: Buy (3.84/5)
Strong Buy
7 (36.8%)
Buy
5 (26.3%)
Hold
5 (26.3%)
Sell
1 (5.3%)
Strong Sell
1 (5.3%)
Strong Sell Sell Hold Buy Strong Buy
3.84 out of 5 based on 19 analysts

About Fair Isaac – Software - Application

fico.us laver software, der bruger analyse og digital beslutningsteknologi til at automatisere og forbedre forretningsbeslutninger globalt. De tjener primært penge på to områder. Det ene er Scores-segmentet, hvor de sælger forudsigelige kredit- og andre scores til virksomheder, som de kan integrere i deres egne processer. Herunder ligger også myFICO.com, som er abonnementer til private. Det andet segment er Software. Her sælger fico.us færdige løsninger til styring af kundeforhold, svindeldetektion og markedsføring. De tilbyder også FICO Platform – et modulært softwaresystem, der understøtter disse funktioner. Virksomheden driver forretning i Amerika, Europa, Mellemøsten, Afrika og Asien og Stillehavsområdet. Read more about the company

Key Figures for Fair Isaac

$ 22,6B Market cap
$ 2,4B Revenue
Software - Application Industry
30.30 P/E
9.45 P/S
82.33 P/B
USA Listed on exchange
fico.com Website

What kind of stock is Fair Isaac?

Growth stock Quality stock

Fair Isaac is classified as a growth stock and quality stock. This means the stock combines several attractive traits, strong financial health (Piotroski 8/9).

Score Overview for Fair Isaac

💰 Value Score 25/100 (Low)
⭐ Quality Score 98/100 (Very High)
🚀 Momentum Score 17/100 (Very Low)
📊 Total Score 46/100

⚠️ 2 red flags identified 1 critical

Our analysis has identified 2 potential risk factors in Fair Isaac that investors should be aware of.

🚨 High debt: The debt-to-equity ratio is 1,000% – the company carries considerably more debt than equity, which raises the financial risk.
⚠️ High short interest: 12.5% of the shares are sold short – many professional investors are betting on price declines.

📈 Valuation

Fair Isaac trades at a P/E ratio of 30.3, which is above the market average. The forward P/E is 20.5 (32% lower), which suggests the market expects rising earnings. The P/S ratio is 9.4 (high — the market pays a premium for the revenue). The P/B ratio is 82.3. The PEG ratio is 0.77 — below 1.0 suggests the stock is cheap relative to its growth rate.

💵 Profitability & Growth

Fair Isaac has a profit margin of 34.1% (excellent) and an operating margin of 53.8%. Return on equity (ROE) is 35.6% — excellent return on equity. Return on assets (ROA) is 40.0%. The latest quarterly earnings grew 41.2% year over year — strong growth.

🏦 Financial Health

The Piotroski score is 8 out of 9 — excellent financial health. Altman Z2 is 12.21 (healthy balance sheet — low risk). The debt-to-equity ratio (D/E) is 1,000.0% — high debt, which raises the risk.

🚀 Momentum & Short Interest

Short interest is 12.46% — very high, the market is skeptical.

Insider Trading in Fair Isaac 2026: The Signal Is negative

In 2026, insiders at Fair Isaac have made 20 transactions – split into 1 purchases and 19 sales. On a net basis, insiders took 24,564,628 $ out of the stock. Active insiders include Rey David A, Manolis Eva, Behl Nikhil and others. In the short term (last 3 months), the insider signal is negative.

Short-Term Signal (3 months): Negative

Insiders have exclusively sold shares over the last 3 months.

Over the last 3 months: 0 purchases and 5 sales. A net 6,048,975 $ out of the stock.

Long-Term Signal (all transactions): Mostly negative

Insiders have sold considerably more than they have bought. At large companies this can be due to planned sales (10b5-1 plans) and is not necessarily a negative signal.

Across the last 20 transactions: 1 purchases and 19 sales. A net 24,564,628 $ out of the stock.

Latest purchase: Rey David A bought 3,192 shares at 248 $ each on 2026-02-24. The stock has since risen 340.5%.

Latest sale: Manolis Eva sold 967 shares at 1,400 $ each on 2026-07-29.

Who is buying: Rey David A.

Who is selling: Manolis Eva, Behl Nikhil, LANSING WILLIAM J, Weber Steven P., Eva Manolis and others.

Latest Insider Trades in Fair Isaac (2026)

The table shows the last 20 reported insider transactions in Fair Isaac. Green rows are purchases, red rows are sales. The data is based on official filings.

Transaction date Name Type Number of shares Price per share ($) Total amount ($)
2026-07-29 Manolis Eva Sell 967 1,400 1,353,800
2026-07-05 Behl Nikhil Sell 242 1,271 307,541
2026-06-05 LANSING WILLIAM J Sell 784 1,137 891,667
2026-05-23 Behl Nikhil Sell 2,194 1,240 2,720,363
2026-05-15 Weber Steven P. Sell 706 1,099 775,605
2026-02-25 Manolis Eva Sell 520 1,228 638,368
2026-02-25 Eva Manolis Sell 520 1,228 638,368
2026-02-24 Rey David A Buy 3,192 248 791,041
2026-02-13 Rees Joanna Sell 358 1,360 486,880
2026-02-13 Joanna Rees Sell 358 1,360 486,880

Who is buying and selling Fair Isaac shares in 2026?

The following insiders have bought shares in Fair Isaac: Rey David A. In total, 791,041 $ was bought across 1 transactions. The following insiders have sold shares: Manolis Eva, Behl Nikhil, LANSING WILLIAM J, Weber Steven P., Eva Manolis and others. In total, 25,355,669 $ was sold across 19 transactions. Insider trades are legal transactions in which executives and board members buy or sell shares of their own company. These transactions are reported to the SEC and are publicly available.

Fair Isaac Short Selling 2026: 12.5% Sold Short

Very high short interest: 12.5% of the free float
Short % of free float
12.5%
Assessment
Very high short interest
Short squeeze risk
High
Data source
SEC
Updated daily
The stock has a very high share of short selling. Between 10-20% of the freely traded shares are sold short, which points to considerable bearish sentiment. A positive earnings report or unexpectedly good news can trigger a short squeeze with sharp price gains.

What does this mean for you as an investor?
A short interest of 12.5% means that 12.5% of the freely traded shares in Fair Isaac have been borrowed and sold by investors betting on falling prices. On positive surprises (e.g. a strong earnings report), short sellers can be forced to buy back shares quickly to close their positions, which can cause a short squeeze with sharp price gains in a short time.

Data is updated daily based on official filings with the SEC.
Short Interest Scale
0% 2% 5% 10% 20%+
Low Moderate High Very High Extreme
12.5%

When Does Fair Isaac Report Earnings?

The next earnings date for Fair Isaac is not yet available. Check the company's investor calendar for more information.


Technical Analysis of Fair Isaac 2026 – Signal: Strong Sell

Overall Technical Signal: Strong Sell

Based on trend analysis (SMA50/SMA200) and MACD trend (positive/negative on a daily + weekly basis). Updated August 6, 2026.

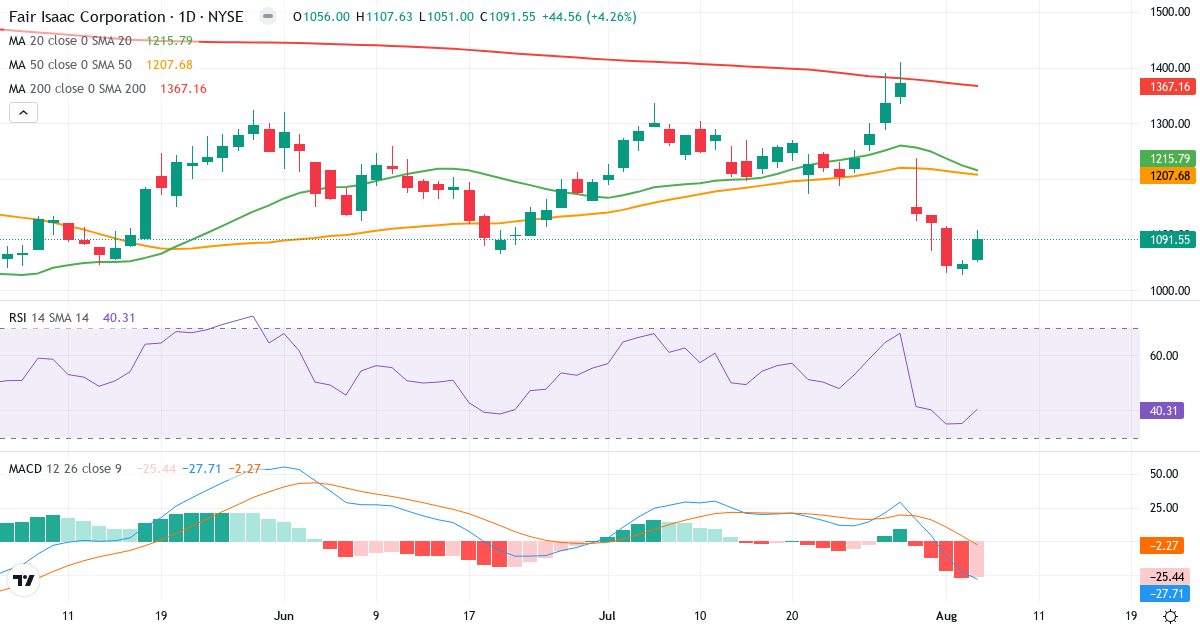
Technical analysis of Fair Isaac (FICO.US) – RSI 40, MACD negative (bearish), daily candlestick chart August 2026
Fair Isaac technical analysis – candlestick chart with RSI and MACD. Updated Aug 6, 2026.

Trend Analysis of Fair Isaac Corporation

Fair Isaac Corporation is in a short-term downtrend. The price of $1,091.55 is 10.2% below the 20-day average ($1,215.79). Medium term, the picture is negative: the price is 9.6% below the 50-day average ($1,207.68). Long term, the stock is 20.2% below the 200-day average ($1,367.16), which signals a long-term downtrend.

Death Cross: The 50-day average (1,207.68) is below the 200-day average (1,367.16), which is a classic bearish signal for Fair Isaac Corporation.

Is Fair Isaac Corporation overbought or oversold?

Fair Isaac Corporation has an RSI of 40.3. The stock sits in the lower part of the neutral zone, which points to weak momentum without being oversold. In the current downtrend, be careful about reading this as a buying opportunity.

MACD Analysis for Fair Isaac Corporation

Daily MACD: MACD is negative (-27.713), which means the short-term trend is bearish (the 12-day EMA is below the 26-day EMA). MACD is below the signal line (-2.271) by 25.442, which confirms growing negative momentum in the downtrend.

Weekly MACD: MACD5 is negative (-54.194), which indicates a broader bearish long-term trend. MACD5 is above the signal line (-79.401) by 25.207, which suggests the negative long-term momentum is fading – a bigger trend reversal could be ahead.

Overall MACD assessment: Both the daily and weekly trend are bearish (MACD negative). However, momentum shows signs of improving on a weekly basis – a potential trend reversal could be ahead, but it is not confirmed yet.

Risk Profile for Fair Isaac Corporation

Fair Isaac Corporation has an annual standard deviation of 53.6%, which classifies the stock as high risk. Sizeable price swings are normal, and the stock requires a higher risk tolerance.

Overall Technical Conclusion for Fair Isaac Corporation

Trend: Negative. The price trades below SMA50 and SMA200.

MACD trend (zero line): Daily bearish (-27.713). Weekly bearish (-54.194).

MACD momentum (signal): Daily falling. Weekly rising.

RSI: 40.3 – neutral.

Technical signal: Strong Sell

The price is in a downtrend (below SMA50/SMA200) and MACD is negative on both a daily and weekly basis. Avoid buying and consider closing existing positions.

Frequently Asked Questions About Fair Isaac stock in 2026

Should you buy Fair Isaac stock now?
No, the technical signal for Fair Isaac is currently SELL. Fair Isaac trades at $1,034.85 as of 8/6/2026. The overall technical signal is: Strong Sell. The technical analysis shows the following: MACD is negative (bearish trend) at -27.713 with falling momentum (signal: -2.271); RSI is at 40.3 (neutral zone); the stock is in a short-term downtrend (price below the 20-day average); the analyst price target of $1,489.48 points to 43.9% upside. The stock is in a broader downtrend (below SMA50/SMA200). Buying in a downtrend is generally not recommended. This is a technical observation based on current data, not investment advice.
What is the price target for Fair Isaac stock?
The average analyst price target for Fair Isaac is $1,489.48. The current price is $1,034.85, which gives an upside of 43.9%. Based on this, the stock is considered undervalued. The fair value range (±10% of the price target) is between $1,340.53 and $1,638.43.
Is Fair Isaac a dividend stock?
No, Fair Isaac does not currently pay a dividend to shareholders. The company reinvests its profits in growth instead of paying dividends.
What is the risk of Fair Isaac stock?
Fair Isaac is rated as a stock with high risk. the annual standard deviation is 53.6%, which classifies the stock as high risk.
Is Fair Isaac overvalued?
No, Fair Isaac is considered undervalued based on the analyst price target (43.9% upside). Fair Isaac has the following valuation ratios: a P/E ratio of 30.3 (highly valued), a P/S ratio of 9.4, a P/B ratio of 82.3. The analyst price target suggests that the stock is undervalued by 43.9%.
Is Fair Isaac overbought?
No, Fair Isaac is not overbought. RSI is at 40.3 (neutral zone). The technical indicators show: RSI is at 40.3 (neutral zone between 30-70), which signals neither overbought nor oversold. In addition, the price is 14.9% below the 20-day average (short-term downtrend). In addition, MACD is negative with falling momentum (bearish).
When is the next Fair Isaac earnings report?
The date of the next earnings report for Fair Isaac has not been published yet. Check the company's investor calendar for updates.
Is Fair Isaac shorted?
Yes, Fair Isaac is shorted with 12.5% of the free float sold short. This is a very high level of short selling, which points to considerable bearish sentiment. A positive earnings report or unexpectedly good news can trigger a short squeeze with sharp price gains. Data is updated daily based on official filings with the SEC.
Are insiders buying Fair Isaac stock?
No, insiders are not buying Fair Isaac shares – they are net sellers. Over the last 3 months, insiders have made 0 purchases and 5 sales. On a net basis, 6,048,975 $ worth of shares were sold. Across the last 20 reported transactions, the split is 1 purchases and 19 sales, with a net 24,564,628 $ sold. Active sellers include Manolis Eva, Behl Nikhil, LANSING WILLIAM J and others. Insider selling can have several explanations (e.g. planned 10b5-1 sales, portfolio diversification or taxes), but sustained selling by several insiders is worth watching closely.
Is Fair Isaac a good stock?
Based on our total score, Fair Isaac is rated as a mediocre stock with a total score of 47 out of 100. The stock scores around average on value, quality and momentum – it sits near the median in our database. The score is made up of Value: 25/100, Quality: 98/100, Momentum: 17/100. In addition: analysts see 43.9% upside to the price target; technical signal: Strong Sell. Whether Fair Isaac is a good investment depends on your time horizon, risk profile and portfolio. This is a data-driven observation, not investment advice.
What is the outlook for Fair Isaac stock?
The outlook for Fair Isaac based on current data: the average analyst price target is $1,489.48 (+43.9%); the stock is in a downtrend (below SMA50 and SMA200); the P/E ratio is 30.3 (high – the market expects growth). Keep in mind that stock prices are affected by many factors, including earnings reports, the economy and market sentiment. Past returns are no guarantee of future returns.
Why is Fair Isaac stock falling?
Fair Isaac is falling right now. The technical indicators show: the price is 14.9% below the 20-day average; MACD is negative with falling momentum (bearish signal); short interest is 12.5% (high – many are betting on a decline); insiders have mostly been selling the stock recently. For the latest context, see our technical analysis, insider section and news overview above.
How high can Fair Isaac go?
The average analyst price target for Fair Isaac is $1,489.48, which corresponds to a potential gain of 43.9% from the current price of $1,034.85. Keep in mind that price targets are estimates, not guarantees. Actual price moves depend on earnings, market conditions and unexpected events.
How low can Fair Isaac fall?
We lack enough history to give a specific floor for Fair Isaac. Remember: past price swings are no guarantee for the future — a stock can fall further than the last 52 weeks suggest, especially on profit warnings, sector crises or a market crash. Use stop-loss orders and spread your portfolio to limit losses in single stocks.
What does Fair Isaac do?
fico.us laver software, der bruger analyse og digital beslutningsteknologi til at automatisere og forbedre forretningsbeslutninger globalt. De tjener primært penge på to områder. Det ene er Scores-segmentet, hvor de sælger forudsigelige kredit- og andre scores til virksomheder... The company belongs to the Teknologi sector, more specifically the Software - Application industry, is headquartered in USA, and is traded on the USA Stocks. See the key figures, earnings history and price development above to evaluate Fair Isaac as an investment.
Did Fair Isaac raise or lower its guidance?
Over the last 60 days we have not registered a guidance raise or cut from Fair Isaac. The company can still adjust its guidance at quarterly reports or between reports — see the earnings history and the news overview above.
Is Fair Isaac making money or losing money?
Yes, Fair Isaac is making money, not losing it. The company has a profit margin (the share of revenue left over as profit) of 34.1% — which is excellent. The operating margin (profit before interest and taxes) is 53.8%. At a P/E ratio of 30.3, you currently pay 30.3 dollars for every dollar of the company's annual earnings. A consistently profitable company is usually more resilient than growth stocks that are not yet making money.
Can Fair Isaac go bankrupt?
The bankruptcy risk of Fair Isaac is rated as low. Altman Z2 (a model for assessing financial distress) is 12.21 — that places the company in the healthy zone. The company has a healthy balance sheet with limited debt relative to earnings and assets. The Piotroski score (financial health 0-9, higher is better) is 8 — which is strong. Debt relative to equity is 1,000% (high). Remember: models like Altman Z2 are statistical — unexpected shocks (fraud, a sector collapse, lawsuits) can always happen. Spread your portfolio.
Does Fair Isaac have a lot of debt?
Yes, Fair Isaac has elevated debt relative to equity. The debt-to-equity ratio (D/E — interest-bearing debt to equity) is 1,000%. For the teknologi sector, anything above 150% counts as elevated — that raises the financial risk, especially if interest rates rise or earnings fall. Note: D/E levels are highly sector-specific — a bank at 300% debt is normal, a tech stock at 300% is extremely leveraged. Always compare with similar companies in the same sector. Can Fair Isaac service its debt? Can service its debt, but it weighs on the company — the interest coverage ratio (how many times earnings can cover interest payments) is 6.3x, and net debt equals 4.2 years of earnings (EBITDA).