Endeavour Silver (EXK.US) Price Target 2026/2027: 75% Upside – Rating and Stock Analysis
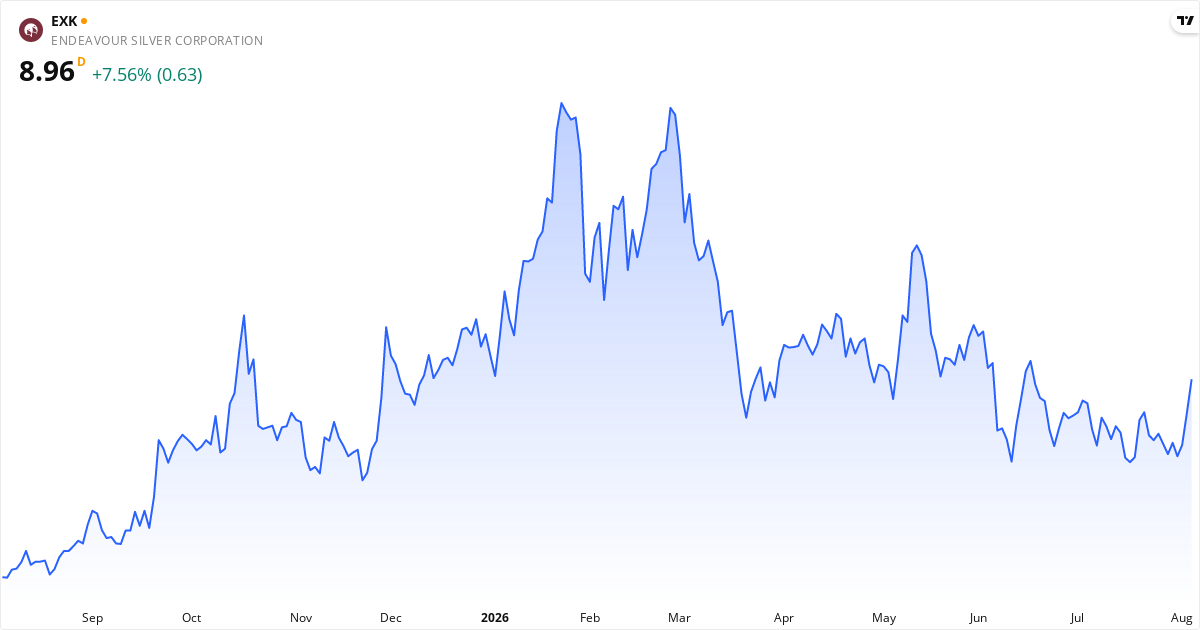
Endeavour Silver Price Target 2026: Analysts See 75% Upside
The average price target for Endeavour Silver is $15.50. This price target represents the analysts' view of the stock price over the next 12 months. The stock may be undervalued, because the price target is higher than the current price. The stock is 74,97% below the target, which can point to potential returns within the next 12 months if the analysts' view proves right. Also consider the stock's valuation ratios such as P/E, P/S and P/B, plus the technical analysis further down the page, for the full picture.Is Endeavour Silver overvalued or undervalued?
Endeavour Silver is currently undervalued with a gap of 75% relative to the price target.
The current price is $8.86, which places Endeavour Silver in the undervalued category. The stock is considered undervalued when the price is below $13.95, and overvalued when the price exceeds $17.05.
The fair value range is defined as ±10% of the price target, because price targets are estimates rather than exact values. For Endeavour Silver, the fair value range lies between $13.95 and $17.05.
Analyst Ratings for Endeavour Silver stock in 2026: Buy
8 analysts cover Endeavour Silver. There is broad agreement on a positive view — 87.5% recommend buying. The average price target is $15.50, which gives an upside of 75% from the current price.
About Endeavour Silver – Sølv
Endeavour Silver Corp. tjener penge på at grave sølv og guld op. De driver miner og står for alt fra efterforskning til selve raffineringen af metallerne. Lige nu driver Endeavour Silver to aktive sølv-guldminer i Mexico: Guanaceví-minen og Bolañitos-minen. Derudover udvikler de to nye projekter i Mexico, Terronera og Parral, som skal sikre fremtidig produktion. Virksomheden blev stiftet i 1981 og har hovedkvarter i Vancouver. De har også tre efterforskningsprojekter i det nordlige Chile, blandt andet Aida sølvprojektet og Paloma guldprojektet. Endeavour Silver fokuserer altså primært på Nord- og Sydamerika, hvor de udvinder ædelmetaller. Read more about the companyKey Figures for Endeavour Silver
What kind of stock is Endeavour Silver?
Endeavour Silver is classified as a stable stock.
Score Overview for Endeavour Silver
📈 Valuation
Endeavour Silver trades at a P/E ratio of 37.9, which is above the market average. The forward P/E is 10.2 (73% lower), which suggests the market expects rising earnings. The P/S ratio is 3.3. The P/B ratio is 3.1.
💵 Profitability & Growth
Endeavour Silver has a profit margin of 8.9% (moderate) and an operating margin of 30.5%. Return on equity (ROE) is 10.6% — solid return on equity. Return on assets (ROA) is 10.1%. The latest quarterly earnings grew -58.6% year over year — falling earnings.
🏦 Financial Health
The Piotroski score is 6 out of 9 — good financial health. Altman Z2 is 2.13 (middle zone — moderate). The debt-to-equity ratio (D/E) is 48.5% — low debt, a solid balance sheet.
🚀 Momentum & Short Interest
Short interest is 2.25%.
Endeavour Silver Short Selling 2026: 2.3% Sold Short
Data is updated daily based on official filings with the SEC.
When Does Endeavour Silver Report Earnings?
The next earnings date for Endeavour Silver is not yet available. Check the company's investor calendar for more information.Technical Analysis of Endeavour Silver 2026 – Signal: Sell
Based on trend analysis (SMA50/SMA200) and MACD trend (positive/negative on a daily + weekly basis). Updated August 6, 2026.
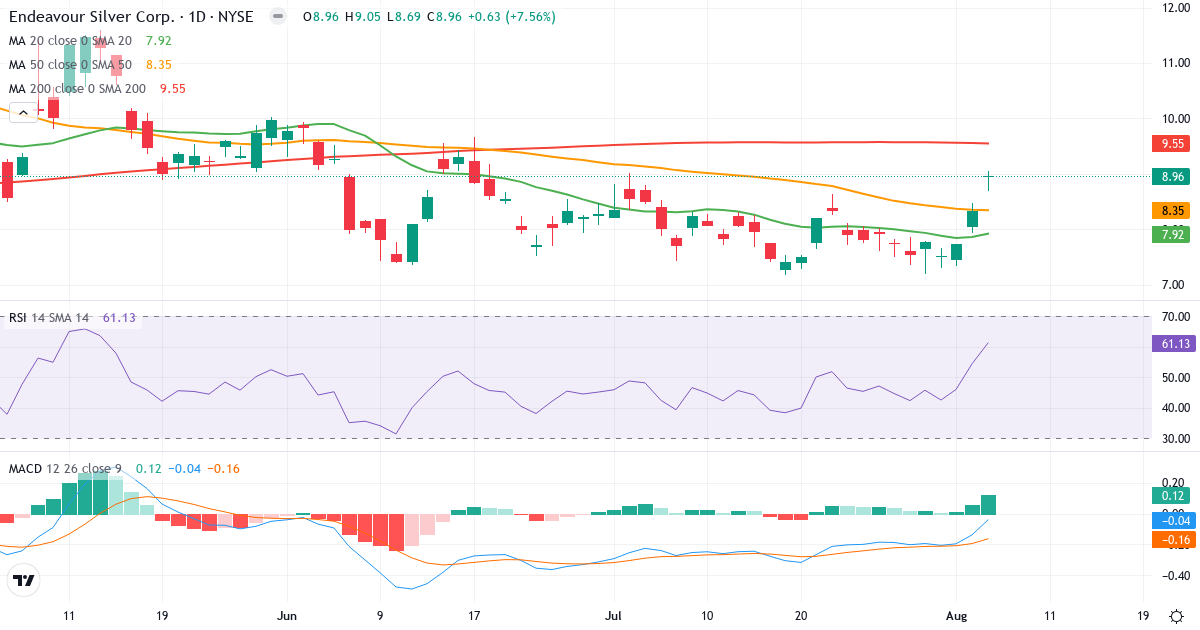
Trend Analysis of Endeavour Silver Corp
Endeavour Silver Corp is in a short-term uptrend. The price of $8.96 is 13.1% above the 20-day average ($7.92). Medium term, the picture is positive: the price is 7.4% above the 50-day average ($8.35). Long term, the stock is 6.2% below the 200-day average ($9.55), which signals a long-term downtrend.
Death Cross: The 50-day average (8.35) is below the 200-day average (9.55), which is a classic bearish signal for Endeavour Silver Corp.
Is Endeavour Silver Corp overbought or oversold?
Endeavour Silver Corp has an RSI of 61.1. The stock shows positive momentum in the upper part of the neutral zone.
MACD Analysis for Endeavour Silver Corp
Daily MACD: MACD is negative (-0.041), which means the short-term trend is bearish (the 12-day EMA is below the 26-day EMA). MACD is above the signal line (-0.164) by 0.123, which suggests the negative momentum is fading – a potential trend reversal could be ahead.
Weekly MACD: MACD5 is negative (-0.413), which indicates a broader bearish long-term trend. MACD5 is below the signal line (-0.164) by 0.249, which confirms continued negative long-term momentum.
Overall MACD assessment: Both the daily and weekly trend are bearish (MACD negative). However, momentum shows signs of improving on a daily basis – a potential trend reversal could be ahead, but it is not confirmed yet.
Risk Profile for Endeavour Silver Corp
Endeavour Silver Corp has an annual standard deviation of 77.9%, which classifies the stock as extreme risk. Only risk-tolerant investors should consider this stock, because the price swings can be very large.
Overall Technical Conclusion for Endeavour Silver Corp
Trend: Neutral/mixed.
MACD trend (zero line): Daily bearish (-0.041). Weekly bearish (-0.413).
MACD momentum (signal): Daily rising. Weekly falling.
RSI: 61.1 – neutral.
Technical signal: Sell
The trend is negative and MACD is below the zero line, which confirms the bearish momentum. Consider reducing the position or setting a stop-loss.