eToro (ETOR.US) Price Target 2026/2027: 60% Upside – Rating and Stock Analysis
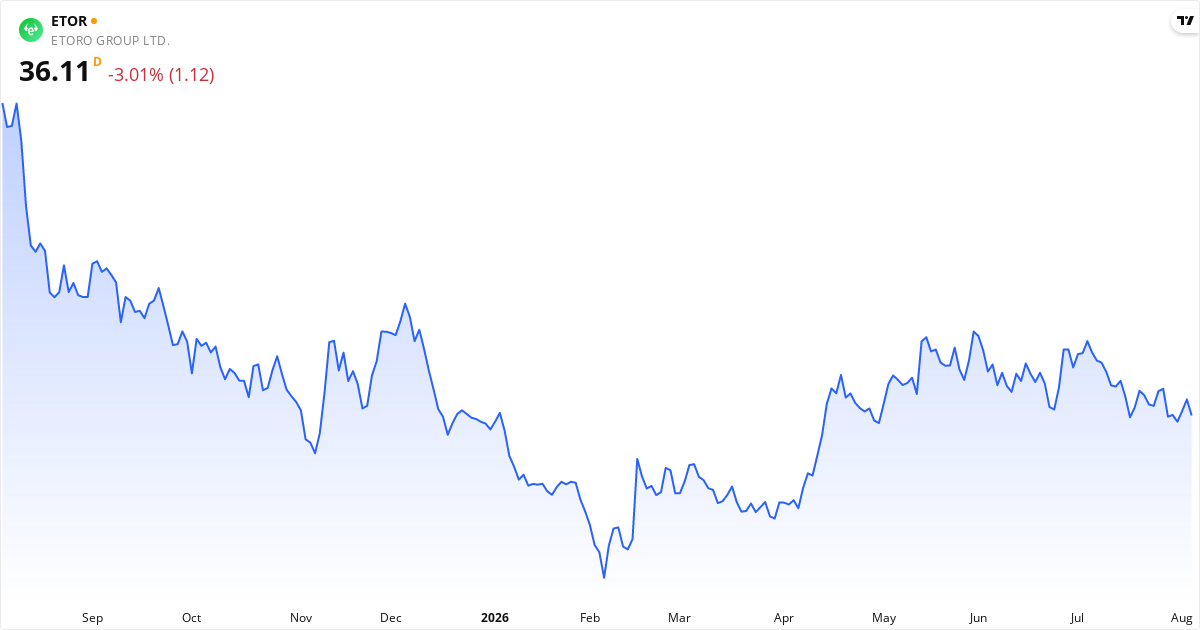
eToro Price Target 2026: Analysts See 60% Upside
The average price target for eToro is $56.93. This price target represents the analysts' view of the stock price over the next 12 months. The stock may be undervalued, because the price target is higher than the current price. The stock is 60,05% below the target, which can point to potential returns within the next 12 months if the analysts' view proves right. Also consider the stock's valuation ratios such as P/E, P/S and P/B, plus the technical analysis further down the page, for the full picture.Is eToro overvalued or undervalued?
eToro is currently undervalued with a gap of 60.1% relative to the price target.
The current price is $35.57, which places eToro in the undervalued category. The stock is considered undervalued when the price is below $51.24, and overvalued when the price exceeds $62.62.
The fair value range is defined as ±10% of the price target, because price targets are estimates rather than exact values. For eToro, the fair value range lies between $51.24 and $62.62.
About eToro – Capital Markets
eToro Group Ltd. engages in the trading business. Its multi-asset platform supports trading and investing in equities, crypto assets, commodities, currencies, and options, which can be traded either as assets or as derivatives related to various underlying asset types. The company also operates eToro Club, a membership program providing a range of services and tools to enhance a user's investment experience; eToro Academy, an education hub to improve users' understanding of financial markets; and eToro Money, a money management solution that enables users to make deposits and withdrawals, as well as to trade local stocks in local currencies. In addition, it provides various investment tools and services, including charting and analysis tools and extended-hours trading. The company was incorporated in 2006 and is based in Bnei Brak, Israel. Read more about the companyKey Figures for eToro
What kind of stock is eToro?
eToro is classified as a growth stock and value stock. This means the stock combines several attractive traits.
Score Overview for eToro
📈 Valuation
eToro trades at a P/E ratio of 15.2, which is close to the market average. The forward P/E is 11.4 (25% lower), which suggests the market expects rising earnings. The P/S ratio is 0.2 (low — potentially undervalued relative to revenue). The P/B ratio is 2.1.
💵 Profitability & Growth
eToro has a profit margin of 1.9% (moderate) and an operating margin of 2.8%. Return on equity (ROE) is 21.0% — excellent return on equity. Return on assets (ROA) is 15.3%. The latest quarterly earnings grew 24.6% year over year.
🏦 Financial Health
The Piotroski score is 7 out of 9 — good financial health. The debt-to-equity ratio (D/E) is 43.1% — low debt, a solid balance sheet.
🚀 Momentum & Short Interest
Short interest is 5.83% — elevated, some investors are betting on a decline.
eToro Short Selling 2026: 5.8% Sold Short
What does this mean for you as an investor?
A short interest of 5.8% means that 5.8% of the freely traded shares in eToro have been borrowed and sold by investors betting on falling prices.
The next potential catalyst is the earnings report on 8/11/2026. With a short interest of 5.8%, the report can trigger considerable volatility.
Data is updated daily based on official filings with the SEC.
When Does eToro Report Earnings – Next Date: 8/11/2026
The next earnings report from eToro is scheduled for August 11, 2026, before the market opens. This report covers the second quarter (Q2), which ended on June 30, 2026.Technical Analysis of eToro 2026 – Signal: Strong Sell
Based on trend analysis (SMA50/SMA200) and MACD trend (positive/negative on a daily + weekly basis). Updated August 6, 2026.
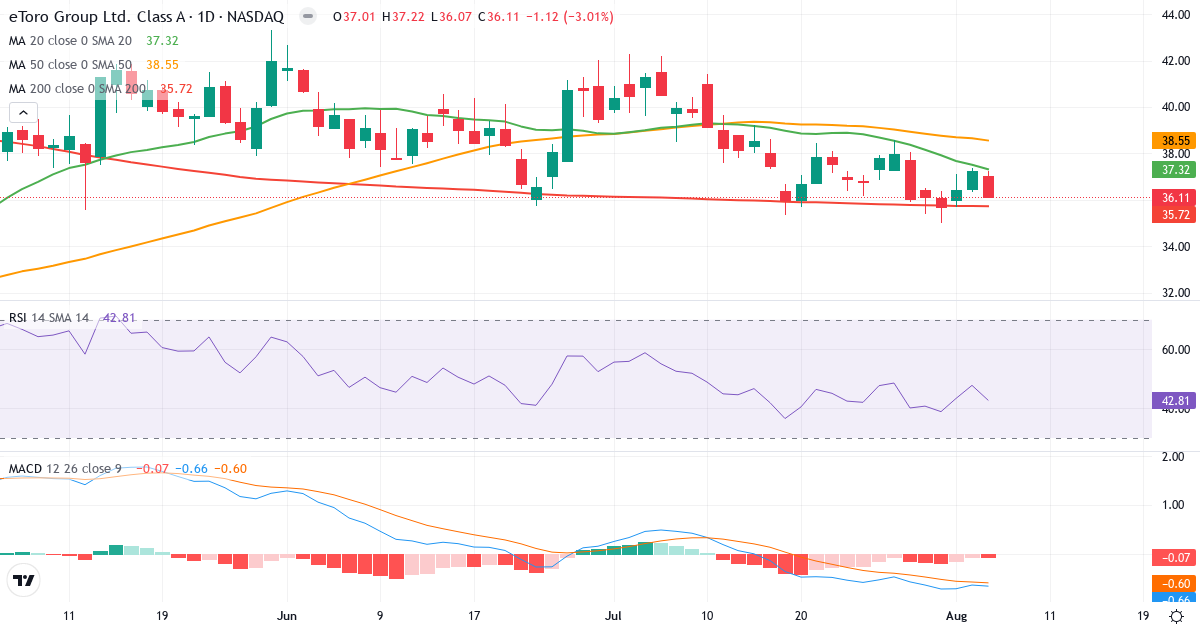
Trend Analysis of eToro Group Ltd.
eToro Group Ltd. is in a short-term downtrend. The price of $36.11 is 3.2% below the 20-day average ($37.32). Medium term, the picture is negative: the price is 6.3% below the 50-day average ($38.56). Long term, the stock is 1.1% above the 200-day average ($35.72), which confirms a long-term uptrend.
Golden Cross: The 50-day average (38.56) is above the 200-day average (35.72), which is a classic bullish signal for eToro Group Ltd..
Is eToro Group Ltd. overbought or oversold?
eToro Group Ltd. has an RSI of 42.8. The stock sits in the lower part of the neutral zone, which points to weak momentum without being oversold. In the current downtrend, be careful about reading this as a buying opportunity.
MACD Analysis for eToro Group Ltd.
Daily MACD: MACD is negative (-0.663), which means the short-term trend is bearish (the 12-day EMA is below the 26-day EMA). MACD is below the signal line (-0.595) by 0.068, which confirms growing negative momentum in the downtrend.
Weekly MACD: MACD5 is negative (-0.016), which indicates a broader bearish long-term trend. MACD5 is above the signal line (-0.297) by 0.281, which suggests the negative long-term momentum is fading – a bigger trend reversal could be ahead.
Overall MACD assessment: Both the daily and weekly trend are bearish (MACD negative). However, momentum shows signs of improving on a weekly basis – a potential trend reversal could be ahead, but it is not confirmed yet.
Risk Profile for eToro Group Ltd.
eToro Group Ltd. has an annual standard deviation of 51.1%, which classifies the stock as high risk. Sizeable price swings are normal, and the stock requires a higher risk tolerance.
Overall Technical Conclusion for eToro Group Ltd.
Trend: Negative. The price trades below SMA50 and SMA200.
MACD trend (zero line): Daily bearish (-0.663). Weekly bearish (-0.016).
MACD momentum (signal): Daily falling. Weekly rising.
RSI: 42.8 – neutral.
Technical signal: Strong Sell
The price is in a downtrend (below SMA50/SMA200) and MACD is negative on both a daily and weekly basis. Avoid buying and consider closing existing positions.