Brookfield Renewable (BEPC.US) Price Target 2026/2027: 20% Upside – Rating and Stock Analysis
33,69
1,17%
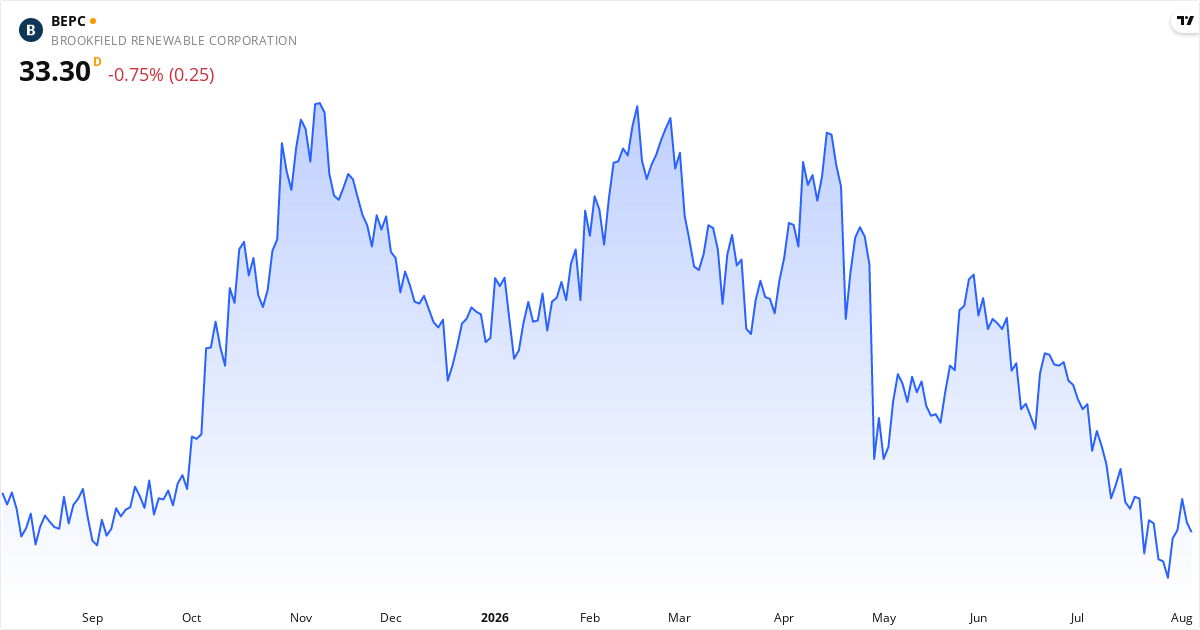
Price history for Brookfield Renewable (BEPC.US) – stock price at 33.69 $, August 2026
Brookfield Renewable stock price – price development 2026. Updated Aug 6, 2026.
Share this analysis:

Brookfield Renewable Price Target 2026: Analysts See 21% Upside

The average price target for Brookfield Renewable is $40.80. This price target represents the analysts' view of the stock price over the next 12 months. The stock may be undervalued, because the price target is higher than the current price. The stock is 21,10% below the target, which can point to potential returns within the next 12 months if the analysts' view proves right. Also consider the stock's valuation ratios such as P/E, P/S and P/B, plus the technical analysis further down the page, for the full picture.

Is Brookfield Renewable overvalued or undervalued?

Brookfield Renewable is currently undervalued with a gap of 21.1% relative to the price target.


The current price is $33.69, which places Brookfield Renewable in the undervalued category. The stock is considered undervalued when the price is below $36.72, and overvalued when the price exceeds $44.88.


The fair value range is defined as ±10% of the price target, because price targets are estimates rather than exact values. For Brookfield Renewable, the fair value range lies between $36.72 and $44.88.


See the full price target analysis for Brookfield Renewable →

Analyst Ratings for Brookfield Renewable stock in 2026: Buy

7 analysts cover Brookfield Renewable. The ratings are mixed, with 57.2% Buy, 42.9% Hold and 0% Sell. The average price target is $40.80, which gives an upside of 21.1% from the current price.

Consensus: Buy (3.71/5)
Strong Buy
1 (14.3%)
Buy
3 (42.9%)
Hold
3 (42.9%)
Strong Sell Sell Hold Buy Strong Buy
3.71 out of 5 based on 7 analysts

About Brookfield Renewable – Utilities - Renewable

Brookfield Renewable Corporation, eller BEPC, driver en stor forretning med grøn energi. De tjener penge ved at producere strøm fra vedvarende kilder. Det er primært vandkraft, vindmøller og solcelleanlæg, som de ejer og styrer. BEPC har en samlet kapacitet på cirka 12.723 megawatt. Deres anlæg er spredt over USA og Europa, men også i Sydamerika, særligt Colombia og Brasilien. Virksomheden blev grundlagt i 2019 og har hovedkvarter i New York. Brookfield Renewable Corporation er altså en global spiller, der fokuserer på at levere stabil, ren energi. Read more about the company

Key Figures for Brookfield Renewable

$ 6,2B Market cap
$ 3,7B Revenue
Utilities - Renewable Industry
- P/E
1.68 P/S
55.31 P/B
USA Listed on exchange

What kind of stock is Brookfield Renewable?

Dividend stock

Brookfield Renewable is classified as a dividend stock with a dividend of 4.7% and a payout ratio of 0%, which points to a sustainable dividend level.

Score Overview for Brookfield Renewable

💰 Value Score 18/100 (Very Low)
⭐ Quality Score 6/100 (Very Low)
🚀 Momentum Score 31/100 (Low)
📊 Total Score 18/100

⚠️ 5 red flags identified 5 critical

Our analysis has identified 5 potential risk factors in Brookfield Renewable that investors should be aware of.

🚨 High debt: The debt-to-equity ratio is 2,388% – the company carries considerably more debt than equity, which raises the financial risk.
🚨 Weak balance sheet (elevated risk): Altman Z2 is -1.97 – the balance sheet is measurably weaker than average. This is a risk signal based on the numbers, not a bankruptcy prediction.
🚨 Negative profit margin: The profit margin is -122.4% – the company is losing money on its operations.
🚨 Negative return on equity: ROE is -47.8% – the company is generating a negative return for shareholders.
🚨 Falling earnings: Quarterly earnings have fallen 99% year over year – the company's profitability is under pressure.

📈 Valuation

The P/S ratio is 1.7. The P/B ratio is 55.3. The PEG ratio is 2.30 — above 2.0 suggests the stock is expensive relative to its growth rate.

💵 Profitability & Growth

Brookfield Renewable and an operating margin of 14.5%. Return on assets (ROA) is 1.1%. The latest quarterly earnings grew -98.9% year over year — falling earnings.

🏦 Financial Health

The Piotroski score is 5 out of 9 — average financial health. Altman Z2 is -1.97 (weak balance sheet — elevated risk). The debt-to-equity ratio (D/E) is 2,387.8% — high debt, which raises the risk.

🚀 Momentum & Short Interest

Short interest is 1.13% — low, the market does not expect a decline.

Brookfield Renewable Dividend 2026: 4.7% Dividend Yield

Dividend Key Figures for Brookfield Renewable in 2026

Dividend yield
4.70%
Dividend per share
0.39 USD
Payout ratio
0.2%
Low
Dividend growth (5 years)
+91.4%
Avg. annual dividend (3 years)
1.30 USD

When does Brookfield Renewable pay a dividend in 2026?

Latest ex-dividend date (traded without the dividend)
May 29, 2026
Next dividend payment
September 29, 2026
Latest payment date
June 30, 2026

How much does Brookfield Renewable pay in dividends?

Brookfield Renewable pays dividends to its shareholders. The most recently paid dividend was 0.39 USD per share, which corresponds to a dividend yield of 4.70%. Over the last 5 years, the annual dividend has grown by 91.4%, which shows positive dividend growth.

The payout ratio is 0.2%, which is low. This suggests the company prioritizes reinvesting in growth over dividend payments. There is good room to raise the dividend in the future.

Historical Dividend Payments for Brookfield Renewable

We have registered dividend payments for Brookfield Renewable since 2020-08-28. In that period the stock has paid a dividend 23 times, most recently on 2026-05-29. This stock qualifies as a stable dividend stock, because it has paid a dividend at least once a year for the last 5 years. That makes it attractive to investors looking for steady, regular dividend payments.

Ex-datePayment dateAmountCurrencyPeriod
2026-05-292026-06-300.39USDUnknown period
2026-02-272026-03-310.39USDUnknown period
2025-11-282025-12-310.37USDUnknown period
2025-08-292025-09-300.37USDUnknown period
2025-02-282025-03-310.37USDUnknown period
2024-11-29N/A0.36USDUnknown period
2024-08-302024-09-270.36USDUnknown period
2024-05-312024-06-280.36USDUnknown period
2024-02-282024-03-280.36USDUnknown period
2023-11-292023-12-290.34USDUnknown period
2023-08-302023-09-290.34USDUnknown period
2023-05-302023-06-300.34USDUnknown period
2023-02-272023-03-310.34USDUnknown period
2022-11-292022-12-300.32USDUnknown period
2022-08-302022-09-290.32USDUnknown period
2022-05-272022-06-300.32USDUnknown period
2022-02-252022-03-310.32USDUnknown period
2021-11-292021-12-310.30USDUnknown period
2021-08-302021-09-290.30USDUnknown period
2021-05-272021-06-300.30USDUnknown period
2021-02-252021-03-310.30USDUnknown period
2020-11-272020-12-310.29USDUnknown period
2020-08-282020-09-300.29USDUnknown period

Brookfield Renewable Short Selling 2026: 1.1% Sold Short

Low short interest: 1.1% of the free float
Short % of free float
1.1%
Assessment
Low short interest
Short squeeze risk
Low
Data source
SEC
Updated daily
The stock has a low share of short selling. Less than 2% of the freely traded shares are sold short, which points to limited bearish sentiment.

Data is updated daily based on official filings with the SEC.
Short Interest Scale
0% 2% 5% 10% 20%+
Low Moderate High Very High Extreme
1.1%

When Does Brookfield Renewable Report Earnings?

The next earnings date for Brookfield Renewable is not yet available. Check the company's investor calendar for more information.


Technical Analysis of Brookfield Renewable 2026 – Signal: Strong Sell

Overall Technical Signal: Strong Sell

Based on trend analysis (SMA50/SMA200) and MACD trend (positive/negative on a daily + weekly basis). Updated August 6, 2026.
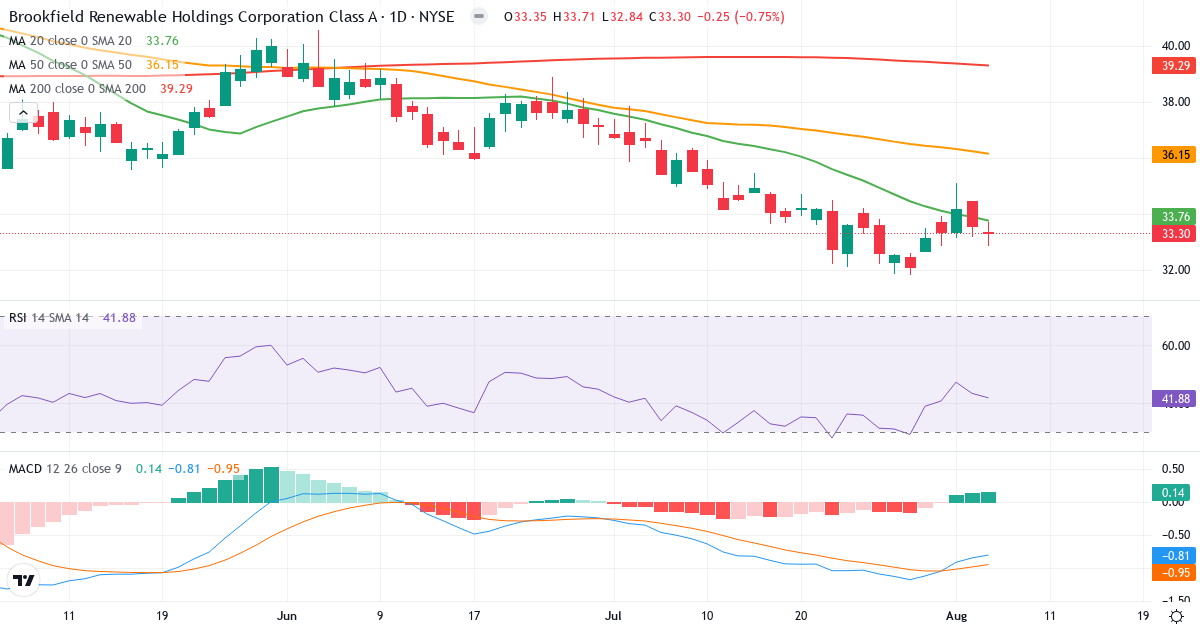
Technical analysis of Brookfield Renewable (BEPC.US) – RSI 42, MACD negative (bearish), daily candlestick chart August 2026
Brookfield Renewable technical analysis – candlestick chart with RSI and MACD. Updated Aug 6, 2026.

Trend Analysis of Brookfield Renewable Corporation

Brookfield Renewable Corporation is in a short-term downtrend. The price of $33.30 is 1.4% below the 20-day average ($33.76). Medium term, the picture is negative: the price is 7.8% below the 50-day average ($36.13). Long term, the stock is 14.1% below the 200-day average ($38.77), which signals a long-term downtrend.

Death Cross: The 50-day average (36.13) is below the 200-day average (38.77), which is a classic bearish signal for Brookfield Renewable Corporation.

Is Brookfield Renewable Corporation overbought or oversold?

Brookfield Renewable Corporation has an RSI of 42.0. The stock sits in the lower part of the neutral zone, which points to weak momentum without being oversold. In the current downtrend, be careful about reading this as a buying opportunity.

MACD Analysis for Brookfield Renewable Corporation

Daily MACD: MACD is negative (-0.798), which means the short-term trend is bearish (the 12-day EMA is below the 26-day EMA). MACD is above the signal line (-0.937) by 0.139, which suggests the negative momentum is fading – a potential trend reversal could be ahead.

Weekly MACD: MACD5 is negative (-1.181), which indicates a broader bearish long-term trend. MACD5 is below the signal line (-0.435) by 0.746, which confirms continued negative long-term momentum.

Overall MACD assessment: Both the daily and weekly trend are bearish (MACD negative). However, momentum shows signs of improving on a daily basis – a potential trend reversal could be ahead, but it is not confirmed yet.

Risk Profile for Brookfield Renewable Corporation

Brookfield Renewable Corporation has an annual standard deviation of 33.2%, which classifies the stock as moderately low risk. There is some volatility, but the price is relatively stable.

Overall Technical Conclusion for Brookfield Renewable Corporation

Trend: Negative. The price trades below SMA50 and SMA200.

MACD trend (zero line): Daily bearish (-0.798). Weekly bearish (-1.181).

MACD momentum (signal): Daily rising. Weekly falling.

RSI: 42.0 – neutral.

Technical signal: Strong Sell

The price is in a downtrend (below SMA50/SMA200) and MACD is negative on both a daily and weekly basis. Avoid buying and consider closing existing positions.

Frequently Asked Questions About Brookfield Renewable stock in 2026

Should you buy Brookfield Renewable stock now?
No, the technical signal for Brookfield Renewable is currently SELL. Brookfield Renewable trades at $33.69 as of 8/6/2026. The overall technical signal is: Strong Sell. The technical analysis shows the following: MACD is negative (bearish trend) at -0.798 with rising momentum (signal: -0.937); RSI is at 42.0 (neutral zone); the stock is in a short-term downtrend (price below the 20-day average); the analyst price target of $40.80 points to 21.1% upside. The stock is in a broader downtrend (below SMA50/SMA200). Buying in a downtrend is generally not recommended. This is a technical observation based on current data, not investment advice.
What is the price target for Brookfield Renewable stock?
The average analyst price target for Brookfield Renewable is $40.80. The current price is $33.69, which gives an upside of 21.1%. Based on this, the stock is considered undervalued. The fair value range (±10% of the price target) is between $36.72 and $44.88.
Is Brookfield Renewable a dividend stock?
Yes, Brookfield Renewable is a dividend stock with a dividend yield of 4.70%. The latest dividend was $0.39 per share. The latest ex-dividend date (traded without the dividend) was 5/29/2026. The payout ratio is 0.2%, which is considered sustainable. The next dividend payment is scheduled for 9/29/2026.
When does Brookfield Renewable pay a dividend in 2026?
Brookfield Renewable pays its next dividend on 9/29/2026. The latest dividend was $0.39 per share with an ex-dividend date of 5/29/2026. The dividend yield is 4.70%. The payout ratio of 0.2% points to a sustainable dividend with room to grow.
What is the risk of Brookfield Renewable stock?
Brookfield Renewable is rated as a stock with moderately low risk. the annual standard deviation is 33.2%, which classifies the stock as moderately low risk.
Is Brookfield Renewable overvalued?
No, Brookfield Renewable is considered undervalued based on the analyst price target (21.1% upside). Brookfield Renewable has the following valuation ratios: a P/S ratio of 1.7, a P/B ratio of 55.3. The analyst price target suggests that the stock is undervalued by 21.1%.
Is Brookfield Renewable overbought?
No, Brookfield Renewable is not overbought. RSI is at 42.0 (neutral zone). The technical indicators show: RSI is at 42.0 (neutral zone between 30-70), which signals neither overbought nor oversold. In addition, the price is 0.2% below the 20-day average (short-term downtrend). In addition, MACD is negative, but momentum is rising (possible trend reversal).
When is the next Brookfield Renewable earnings report?
The date of the next earnings report for Brookfield Renewable has not been published yet. Check the company's investor calendar for updates.
Is Brookfield Renewable shorted?
Yes, Brookfield Renewable is shorted with 1.1% of the free float sold short. This is a moderate level of short selling, within the normal range for most stocks. Data is updated daily based on official filings with the SEC.
Are insiders buying Brookfield Renewable stock?
There is currently no registered insider trading for Brookfield Renewable.
Is Brookfield Renewable a good stock?
Based on our total score, Brookfield Renewable is rated as a disastrous stock with a total score of 18 out of 100. The stock scores very low on value, quality and momentum – it is among the worst in our database. The score is made up of Value: 18/100, Quality: 6/100, Momentum: 31/100. In addition: analysts see 21.1% upside to the price target; a dividend of 4.70%; technical signal: Strong Sell. Whether Brookfield Renewable is a good investment depends on your time horizon, risk profile and portfolio. This is a data-driven observation, not investment advice.
What is the outlook for Brookfield Renewable stock?
The outlook for Brookfield Renewable based on current data: the average analyst price target is $40.80 (+21.1%); the stock is in a downtrend (below SMA50 and SMA200). Keep in mind that stock prices are affected by many factors, including earnings reports, the economy and market sentiment. Past returns are no guarantee of future returns.
Why is Brookfield Renewable stock moving?
Brookfield Renewable is stable right now. The technical indicators show: the price is close to the 20-day average. For the latest context, see our technical analysis, insider section and news overview above.
How high can Brookfield Renewable go?
The average analyst price target for Brookfield Renewable is $40.80, which corresponds to a potential gain of 21.1% from the current price of $33.69. Keep in mind that price targets are estimates, not guarantees. Actual price moves depend on earnings, market conditions and unexpected events.
How low can Brookfield Renewable fall?
We lack enough history to give a specific floor for Brookfield Renewable. Remember: past price swings are no guarantee for the future — a stock can fall further than the last 52 weeks suggest, especially on profit warnings, sector crises or a market crash. Use stop-loss orders and spread your portfolio to limit losses in single stocks.
What does Brookfield Renewable do?
Brookfield Renewable Corporation, eller BEPC, driver en stor forretning med grøn energi. De tjener penge ved at producere strøm fra vedvarende kilder. Det er primært vandkraft, vindmøller og solcelleanlæg, som de ejer og styrer. BEPC har en samlet kapacitet på cirka 12.723 meg... The company belongs to the Forsyning sector, more specifically the Utilities - Renewable industry, is headquartered in USA, and is traded on the USA Stocks. See the key figures, earnings history and price development above to evaluate Brookfield Renewable as an investment.
Did Brookfield Renewable raise or lower its guidance?
Over the last 60 days we have not registered a guidance raise or cut from Brookfield Renewable. The company can still adjust its guidance at quarterly reports or between reports — see the earnings history and the news overview above.
Is Brookfield Renewable making money or losing money?
No, Brookfield Renewable is currently not making money — the company is losing money with a negative profit margin of -122.4%, a substantial loss. That means the business loses money on every dollar of revenue. The operating margin, however, is positive at 14.5% — the core business makes money; the loss comes from financing costs, taxes or one-off items. For growth stocks investing in expansion this is normal — but it raises the risk if the company does not reach break-even before its capital runs out.
Can Brookfield Renewable go bankrupt?
The bankruptcy risk of Brookfield Renewable is rated as elevated. Altman Z2 (a model for assessing financial distress) is -1.97 — that places the company in the weak zone. This is a probability based on the numbers, not a verdict — bankruptcy is not imminent. But the balance sheet is measurably weaker than average, so watch the debt, liquidity and possible capital raises. The Piotroski score (financial health 0-9, higher is better) is 5 — which is average. Debt relative to equity is 2,388% (high). Remember: models like Altman Z2 are statistical — unexpected shocks (fraud, a sector collapse, lawsuits) can always happen. Spread your portfolio.
Does Brookfield Renewable have a lot of debt?
Yes, Brookfield Renewable has elevated debt relative to equity. The debt-to-equity ratio (D/E — interest-bearing debt to equity) is 2,388%. For the forsyning sector, anything above 150% counts as elevated — that raises the financial risk, especially if interest rates rise or earnings fall. Note: D/E levels are highly sector-specific — a bank at 300% debt is normal, a tech stock at 300% is extremely leveraged. Always compare with similar companies in the same sector. Can Brookfield Renewable service its debt? Could struggle to service its debt — the interest coverage ratio (how many times earnings can cover interest payments) is -0.9x, and net debt equals 7.3 years of earnings (EBITDA).